

Image Source: Pixabay
Based on this seasonality chart of the U.S. midterm elections for the past 72 years, the stock market could be already entering the bottoming process. Seasonality or cyclical charts are often used in analog comparison in the Wyckoff trading method although history doesn’t repeat itself, but it often rhymes.
It is really uncanny to see how S&P 500 moved as per this seasonality chart in the first half of 2022.
Video Length: 00:16:52
The bullish setup vs. the bearish setup is 245 to 199 from the screenshot of my stock screener below. The sharp drop in the bearish setup and mild increase in the bullish setup from last week are encouraging signs for the bullish scenario, which is also reflected in the improvement of the market breadth as explained last week.
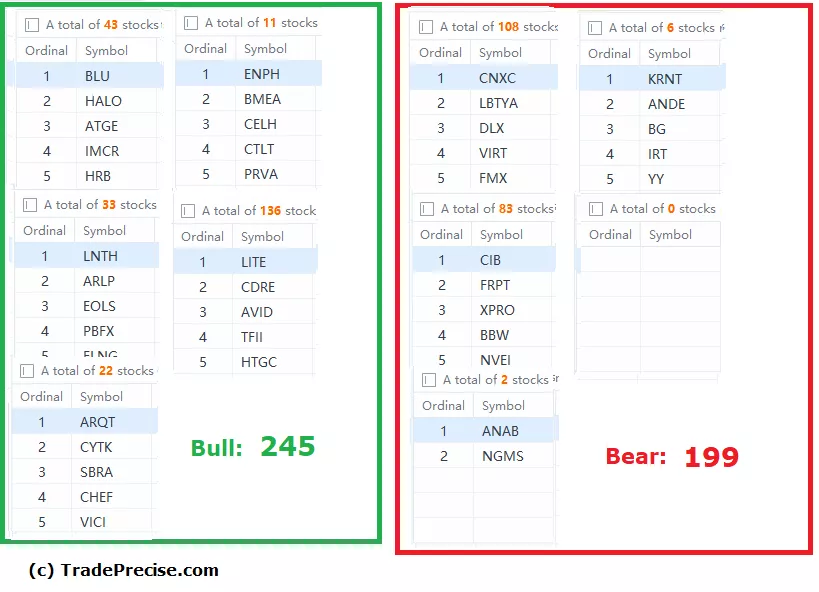
Should the bottoming process unfold like the seasonality chart as shown in the video, outperforming stocks will start to move up and could be the future leadership in the next bull run.
More By This Author:
Market Breadth Indicator Signals The Next Big Move In S&P 500
Wyckoff Accumulation Reveals The Next Bull Run For This Sector
Watch Out For This Silver Lining - A Failure Will Result In A Stock Market Crash


Comments
Log in or sign up to join the conversation.