

Image Source: Unsplash
The bullish divergence in the stock market breadth and the price-volume analysis of the S&P 500 using the Wyckoff method suggest a potential big move ahead.
Pay attention to the analog comparison using the Wyckoff trading method to spot the clues and tell-tale signs for the next big move.
Video Length: 00:16:33
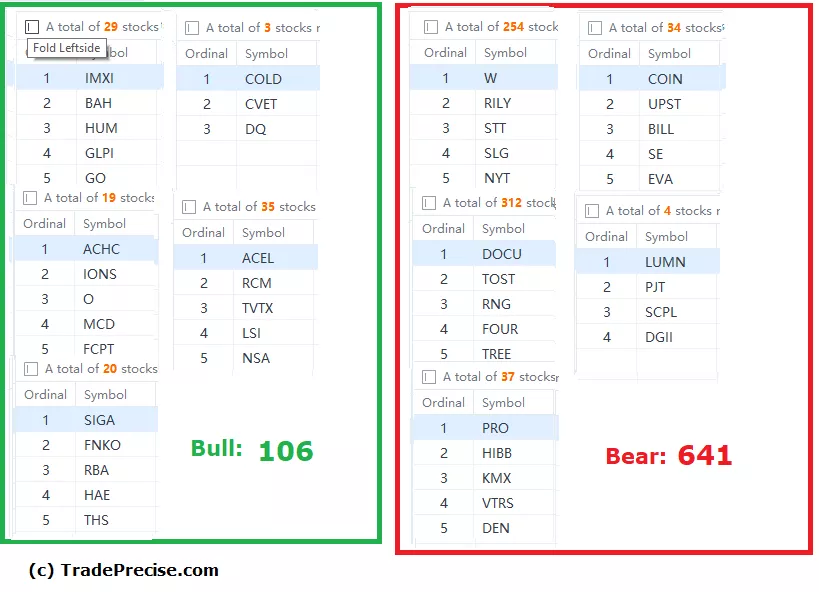
The bullish setup vs. the bearish setup is 106 to 641 from the screenshot of my stock screener below. The bearish setup has spiked from 80 to 641, as the market dropped from 2–4% last week. Yet, the bullish setup has increased from 24 to 106, which was a constructive sign for the bullish scenario despite the bearish market.
Another encouraging sign is the addition of 1 more industry group that outperforms the market on top of the China stocks theme and the Biotech group.


Comments
Log in or sign up to join the conversation.