Here Is How To Predict The Next Bull Run With The Wyckoff Trading Method
Image Source: Unsplash
Here is where the stock market could be heading according to the Wyckoff method together with the price target projection using Point and Figure chart.
Watch the video below and pay attention to how to anticipate and confirm both the bullish and the volatile movement by identifying Wyckoff accumulation pattern for traditional and unorthodox Wyckoff schematic.
Video Length: 00:08:34
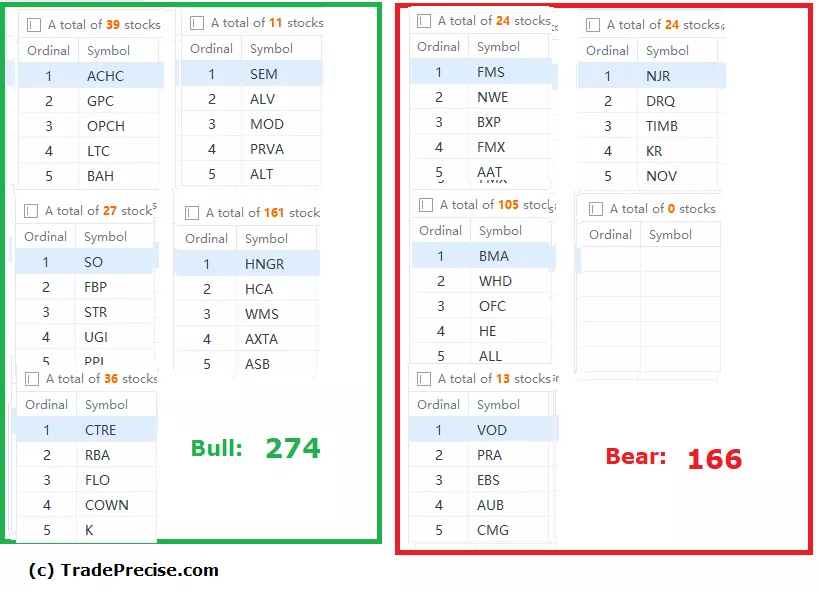
The bullish setup vs. the bearish setup is 274 to 166 from the screenshot of my stock screener below. Despite the pullback on last Friday, there are still plenty of outperforming stocks ready for entry setup.

Do bear in mind that although the short-term direction is to the upside, this is still a bear market rally. Volatility on both sides is expected. Right risk management is necessary when trading with the top market leaders.
More By This Author:
10 Top Market Leaders That Could Emerge As Multibaggers In The Next Bull Market
Stock Market Bottom?
Market Breadth Indicator Signals The Next Big Move In S&P 500
Disclaimer: The information in this presentation is solely for educational purpose and should not be taken as investment advice.


