Taking Stock Of The Earnings Picture - Friday, Nov. 22

Image Source: Pexels
Nvidia’s (NVDA - Free Report) quarterly results were excellent, with the chip giant not only beating estimates and raising guidance but also achieving top- and bottom-line growth rates that are typically associated with start-up players.
Nvidia’s Q3 earnings increased +106.3% from the year-earlier period to $19.37 billion while revenues were up +93.6% year-over-year to +35.08 billion.
To get a sense of the market’s lukewarm reaction to these otherwise impressive results from Nvidia, take a look at the chart below that plots the stock price relative to how estimates consensus EPS estimates have evolved over time.
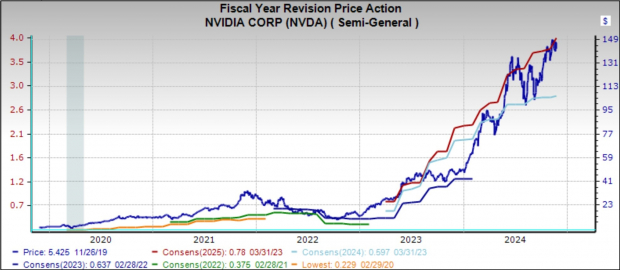
Image Source: Zacks Investment Research
The chart's light blue and red lines represent the evolution of consensus EPS estimates for 2024 and 2025, respectively. The steepness of those lines shows how persistent the favorable revisions trend has been, with analysts seemingly struggling to catch up with how strong underlying business trends have been for Nvidia.
Nvidia’s stock market momentum has made its market capitalization the highest of the Magnificent 7 group at $3.59 trillion, surpassing Apple at $3.45 trillion and Microsoft at $3.07 trillion. Investors’ lukewarm reaction suggests that they have become used to getting far bigger guidance upgrades than what they received this time around. Nvidia’s upgraded guidance is solid, but relatively underwhelming by the company’s own standards.
We don’t want to come across as making too big of a deal of the stock’s reaction to the quarterly results. After all, Nvidia shares are up +191.3% over the past year and have handily outperformed the Zacks Tech sector (up +32.5%), the S&P 500 index (up +30.4%), and the Mag 7 group (up +20.6%).
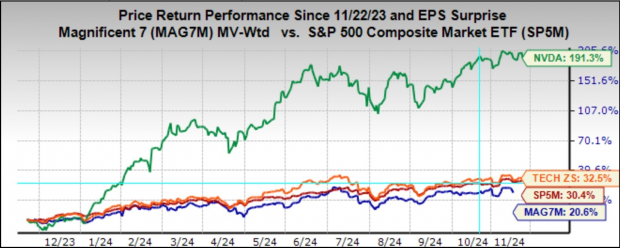
Image Source: Zacks Investment Research
Beyond Nvidia, the focus lately has been on the Retail sector, with several major conventional operators coming out with quarterly results. Through Friday, November 22nd, we have seen Q3 results from 29 of the 34 Retail sector companies in the S&P 500 index.
Regular readers know that Zacks has a dedicated stand-alone economic sector for the retail space, which is unlike the placement of the space in the Consumer Staples and Consumer Discretionary sectors in the Standard & Poor’s standard industry classification.
The Zacks Retail sector includes not only Walmart, Home Depot, and other traditional retailers, but also online vendors like Amazon (AMZN - Free Report) and restaurant players.
Total Q3 earnings for these 29 retailers that have reported are up +12.8% from the same period last year on +5.6% higher revenues, with 58.6% beating EPS estimates and only 51.7% beating revenue estimates.
The comparison charts below put the Q3 beats percentages for these retailers in a historical context.

Image Source: Zacks Investment Research
As you can see above, members of the Zacks Retail sector have struggled to beat estimates in Q3, with the trend particularly notable on the EPS beats front that are tracking below the 20-quarter low at this stage.
Concerning the elevated earnings growth rate at this stage, we like to show the group’s performance with and without Amazon, whose results are among the 24 companies that have reported already. As we know, Amazon’s Q3 earnings were up +71.6% on +11% higher revenues, as it beat EPS and top-line expectations.
As we all know, the digital and brick-and-mortar operators have been converging for some time now. Amazon is now a decent-sized brick-and-mortar operator after Whole Foods, and Walmart is now a growing online vendor. This long-standing trend got a huge boost from the Covid lockdowns.
The two comparison charts below show the Q3 earnings and revenue growth relative to other recent periods, both with Amazon’s results (left side chart) and without Amazon’s numbers (right side chart).

Image Source: Zacks Investment Research
Q3 Earnings Season Scorecard
Through Friday, November 22nd, we have seen Q3 results from 476 S&P 500 members, or 92.2% of the index’s total membership. We have another 8 S&P 500 members on deck to report results this holiday-shortened week, including Dell, HP, Best Buy, and others.
Total earnings for these 476 companies that have reported are up +8.1% from the same period last year on +5.5% higher revenues, with 73.7% of the companies beating EPS estimates and 61.8% beating revenue estimates.
The proportion of these 476 index members beating both EPS and revenue estimates is 51.1%.
The comparison charts below put the Q3 earnings and revenue growth rates and the EPS and revenue beats percentages in a historical context. The first set of comparison charts show the earnings and revenue growth rates.

Image Source: Zacks Investment Research
One significant drag on the aggregate growth pace has been the Energy sector, whose Q3 earnings were down -22.9% from the same period last year on -2.7% lower revenues. Q3 earnings for the index would be up +10.6% on +6.3% higher revenues had it not been for this Energy sector drag. The comparison charts below show the ex-Energy earnings and revenue growth pace across different periods.

Image Source: Zacks Investment Research
The second set of comparison charts compare the Q3 EPS and revenue beats percentages in a historical context.

Image Source: Zacks Investment Research
The comparison charts below spotlight the revenue performance and the blended beats percentage for this group of 476 index members.

Image Source: Zacks Investment Research
As you can see above, the growth trend appears stable-to-positive, though fewer companies are beating consensus estimates relative to other recent periods. In fact, both the EPS and revenue beats percentages are tracking below the 20-quarter averages.
The Earnings Big Picture
Looking at Q3 as a whole, combining the results that have come out with estimates for the still-to-come companies, total earnings for the S&P 500 index are expected to be up +8.1% from the same period last year on +5.7% higher revenues.
The chart below shows the Q3 earnings and revenue growth pace in the context of where growth has been in the preceding four quarters and what is expected in the coming three quarters.
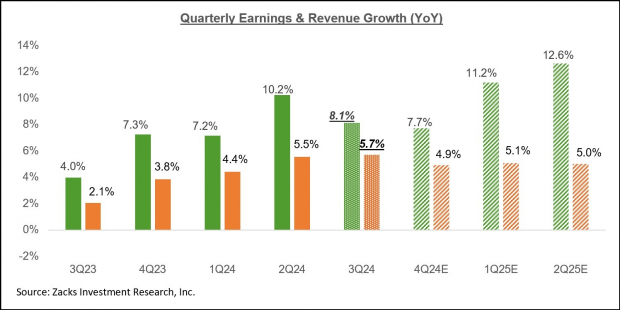
Image Source: Zacks Investment Research
The Energy and Tech sectors are having the opposite effects on the Q3 earnings growth pace, with the Energy sector dragging it down and the Tech sector pushing it higher.
Had it not been for the Energy sector drag, Q3 earnings for the S&P 500 index would be up +10.6% instead of +8.1%. Excluding the Tech sector’s substantial contribution, Q3 earnings growth for the rest of the index would be up only +2.9% instead of +8.1%.
Excluding the contribution from the Mag 7 group, Q3 earnings for the rest of the 493 S&P 500 members would be up only +2.4% instead of +8.1%.
For the last quarter of the year (2024 Q4), total S&P 500 earnings are expected to be up +7.7% from the same period last year on +4.9% higher revenues.
Unlike the unusually high magnitude of estimate cuts that we had seen ahead of the start of the Q3 earnings season, estimates for Q4 are holding up a lot better, as the chart below shows.
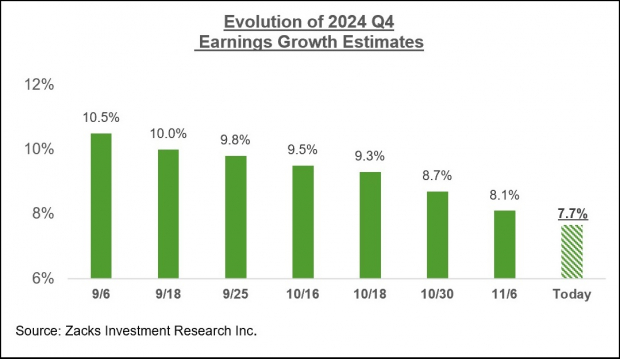
Image Source: Zacks Investment Research
The chart below shows the overall earnings picture on a calendar-year basis, with the +7.9% earnings growth this year followed by double-digit gains in 2025 and 2026.
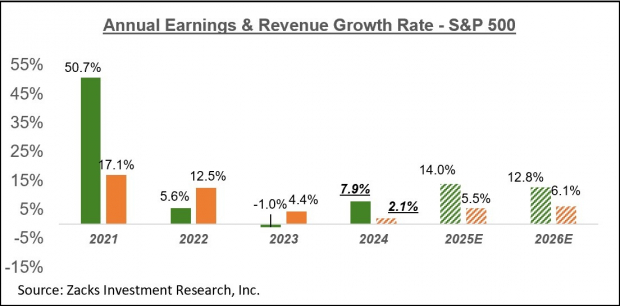
Image Source: Zacks Investment Research
Please note that this year’s +7.9% earnings growth improves to +9.9% on an ex-Energy basis.
More By This Author:
What Can Investors Expect From Retail Earnings?
Looking Ahead To Retail Sector Earnings
Retail Earnings Loom: A Closer Look


