
Supply-Side Inflation Hits Home
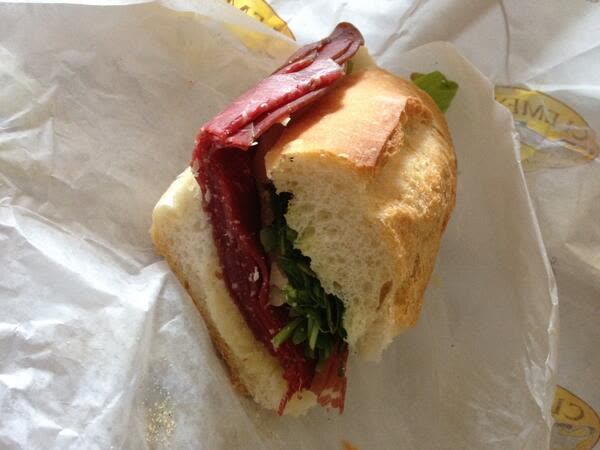
Our usual Italian deli sandwich, in better times: Bresaola, arugula, sliced Parmesan, olive oil, and fresh-squeezed lemon juice, on Italian bread.
More Expensive And Worse
Sometimes an anecdote or experience illustrates economic reality better than statistics do. On Tuesday, we went to our local Italian deli for the first time in a month or two and ordered our usual sandwich, expecting it to cost $11 like it did last time. It had taken us a while to get accustomed to paying $11 for a sandwich that had been $8 a few years ago. On Tuesday, the price was $15.
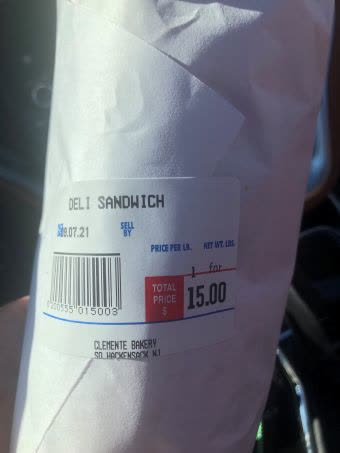
Not only was it more expensive, but it wasn't as good. The deli had skimped on the bresaola and the olive oil. It turns out we weren't the only ones to experience this recently.
A Reluctant Inflation Crank
In a Wednesday post ("How I reluctantly Became An Inflation Crank"), economist Alan Cole described a recent breakfast:
This summer I stayed at a hotel from a well-known brand in an upscale suburb. The breakfast was comically unimpressive: little more than some individual cereal boxes, a limited assortment of poorly-cooled beverages, and paper dishware. And I could tell that it hadn’t always been that way: the room was large and had obviously been designed to host a more impressive spread in the days before COVID-19.
This put me into thought. Not self-pity—the Raisin Bran was fine, and I was happy to cut the hotel some slack. No, I was thinking about how economists measure production, and how these pandemic-induced degradations in quality are likely not fully reflected in our economic statistics.
Cole's point was that, even if you are paying the same price for a product or service, if the quality has declined, that's inflation, because you're getting less for your money. An obvious-in-hindsight example of this he used was pandemic-era college: students (or their parents) may have paid similar tuition rates as a couple of years ago, but many classes were virtual, and students missed out on a lot of the social activities traditionally associated with college.
Supply-Side Inflation
In a recent post (Huge Jobs Miss Fuels Inflation Trade), we reminded readers of an inflation trade we had presented here in early July:
In a nice bit of synergy, Bloomberg licenses its commodity indexes to the sponsors of exchange traded products. So not only does it report on rising commodity prices, but it also profits from them. Coincidentally, one of those exchange traded products, the ProShares Ultra Bloomberg Natural Gas ETF (BOIL) was one of our system's top ten names on Friday, July 2nd [We post our top ten names every trading day on our Portfolio Armor website and app].
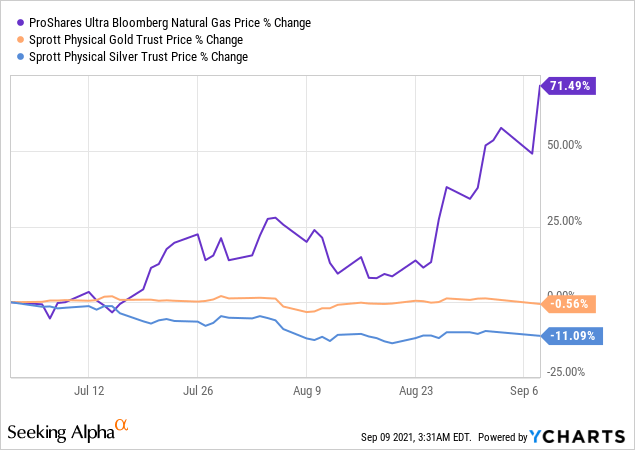
We also noted that our natural gas pick BOIL had outperformed precious metals since then. Here's an updated performance chart of BOIL versus the Sprott Physical Gold Trust (PHYS) and Sprott Physical Silver Trust (PSLV) since July 2nd.
Alan Cole's post explains why industrial commodities like natural gas have outperformed precious metals this year: we are experiencing supply-side inflation (not enough stuff), not demand-side inflation (too much money):
One reason I was hesitant to deploy this line of logic is that it might convince people that the government should employ contractionary policy like Federal Reserve rate hikes, or tax increases, or spending cuts, in order to combat high inflation.
The problem with this line of reasoning is that this is supply-side inflation, and the government should not use demand-side policy on supply-side inflation.
Despite the supply-side inflation, a 71% gain in a couple of months on BOIL calls for caution. Here's a way to lock in some gains if you bought the ETF when we wrote about it in July but haven't hedged yet.
Locking In BOIL Gains
Last week, we posted a video showing how to scan for optimal hedges on BOIL.
Video Length: 00:04:36
That video is still worth watching as a how-to, but after Wednesday's 15% rip higher in BOIL, an updated hedge is in order. Here it is.
This was the optimal collar, as of Wednesday's close, to hedge 1,000 shares of BOIL against a >25% decline by March while not capping your possible upside at less than 29%.
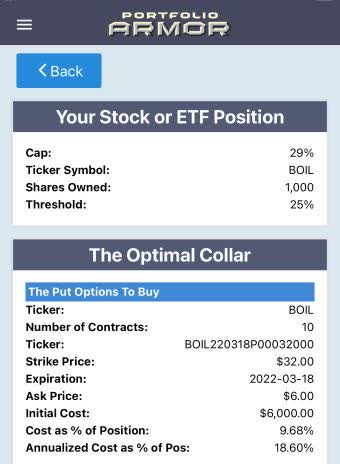
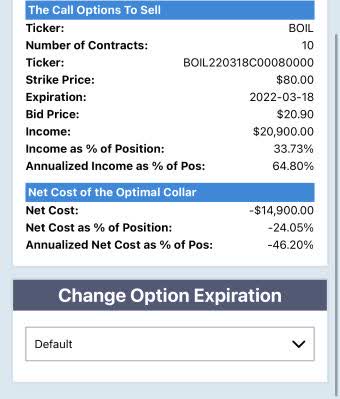
Screen captures via the Portfolio Armor iPhone app.
Note that the net cost there was negative, meaning you would have collected a net credit of $14,900, or 24.05% of position value, when opening that hedge. So your maximum upside taking that into account was about 53%.
Disclaimer: The Portfolio Armor system is a potentially useful tool but like all tools, it is not designed to replace the services of a licensed financial advisor or your own independent ...
more

