

Image Source: Pexels
Sentiment is diverging widely. Stock market sentiment is clearly quite positive, if not outright exuberant; the rest of the country – not so much. This morning’s release from the University of Michigan offered another set of gloomy readings about sentiment and expectations. The stock market, riding at all-time highs, barely rippled. It is another sign that we are likely in a “K-shaped economy”.
That construct refers to an economy that is benefitting some even as others suffer.In this case, we believe that those at the higher end of the income and/or wealth spectrum feel better about their prospects while those at the lower end are feeling worse.Rising asset prices, whether in stocks, gold, crypto, or other items, benefit those who have the financial wherewithal to invest in them.People without those resources are clearly showing concern about tenuous economic conditions, whether via sentiment surveys or the recent underperformance of stores like Dollar Tree (DLTR) and Dollar General (DG).
An open question is where the breakpoint lies.I like to think of the vertical line in the “K” as the y-axis of a graph, with income percentiles as the scale.This is why today’s piece leads with the question about which “k” we might be seeing.A small “k” implies that only those with relatively low incomes are feeling stress; a capital “K” implies that the difference occurs at relatively median incomes.Could it be that we’re looking at something like an upside-down small “k”, something like the image below, implying that only those with relatively high incomes are feeling sanguine?
![]()
Looking at today’s report, something is clearly bothering the survey respondents.All the data is worse than both expectations and last month’s values except for 1-year inflation expectations.Those were in line, but 4.8% inflation would of course be extraordinarily troublesome.Stocks shrugged off yesterday’s CPI report, which revealed a higher than expected headline and a stealthy rise in the core, but the public seems far from willing to ignore what they perceive as creeping inflation.
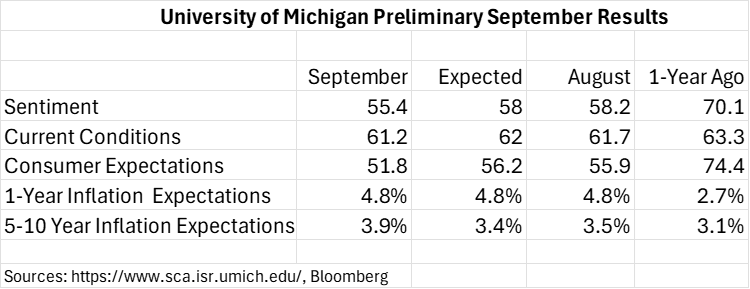
At various times we have shown how 1-year inflation expectations have historically tracked retail gasoline prices.We’ve also shown when they have diverged, noting that the divergences were usually temporary, or perhaps transitory.We currently see one of the largest divergences in recent years, and it shows few signs of reverting to the norm:
UMich 1-Year Inflation Expectations (yellow) vs. AAA Daily National Average Regular Unleaded Gasoline Prices (green); Monthly Data Since January 2010
(Click on image to enlarge)
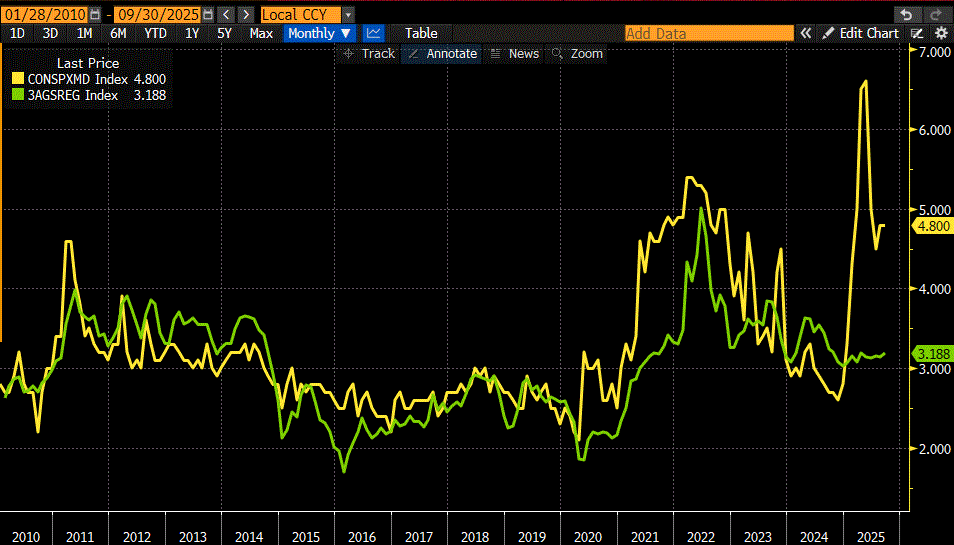
Source: Bloomberg
If these trends persist, with investor sentiment diverging wildly from non-investors, one might expect that the dour views of a significant portion of the population would eventually weigh on stock prices.It certainly seems that they should. But divergences in sentiment can persist for quite some time.And of course there are two ways to close a divergence – the top can come down or the bottom can come up.Hopefully for investors, it will be the latter.
More By This Author:
Today’s Rally Is Based On A Whisker
Seasonality, Or Something Else?
From A Big Event To A Yawn


Comments
Log in or sign up to join the conversation.