
Based on residential investment construction July release (starts 1.428 mn > 1.29 mn Bbg consensus; permits 1.354mn < 1.39mn Bbg consensus):
(Click on image to enlarge)
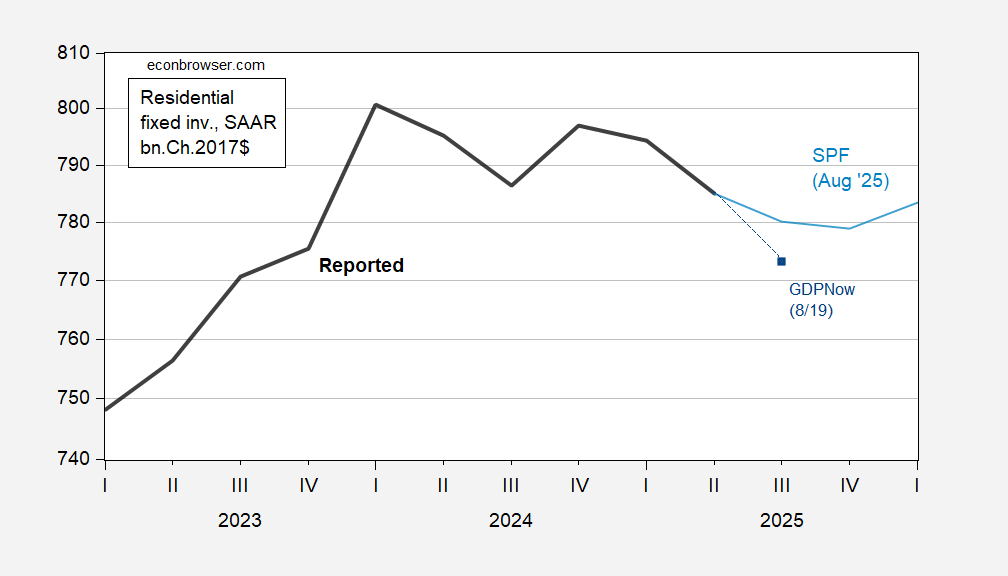
Figure 1: Residential fixed investment (bold black), Survey of Professional Forecasters August median f’cast (light blue), GDPNow of 8/19 (dark blue square), all in bn.Ch.2017$, SAAR. Source: BEA 2025Q2 advance, Philadelphia Fed, Atlanta Fed, and author’s calculations.
The nowcast undershoots noticeably the Survey of Professional Forecasters’ median, with responses from just a couple weeks ago.
Real 10yr interest rates and nominal mortgage rates are slightly below where they were in January 2025, so I’ll focus on policy uncertainty as a possible determinant of the decline in residential investment. (Although with housing prices declining according to the S&P Case-Shiller index, the real interest rate so defined has risen.)
(Click on image to enlarge)
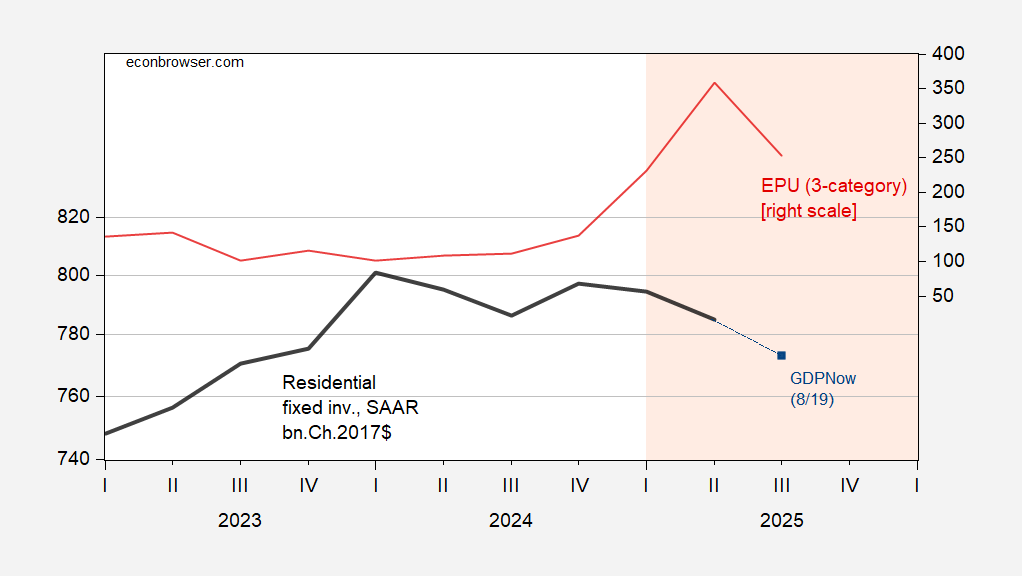
Figure 2: Residential fixed investment (bold black, left scale), GDPNow of 8/19 (dark blue square, left scale), both in bn.Ch.2017$, SAAR, and EPU (3 category legacy series), (red, right scale). Q3 EPU is for July. Light orange shading denotes Trump 2.0 administration. Source: BEA 2025Q2 advance, Atlanta Fed, policyuncertainty.com, and author’s calculations.
GDPNow registers 2.3% q/q AR growth for Q3, down from 2.5 last release. Goldman Sachs tracking as of yesterday was 1.4%.
More By This Author:
Reserves, Sanctions And Tariffs In A Time Of Uncertainty
Coffee Drinkers Of America, Unite
PPI => CPI?


Comments
Log in or sign up to join the conversation.