

Image Source: Pixabay
Here’re the July PPI and CPI for coffee.
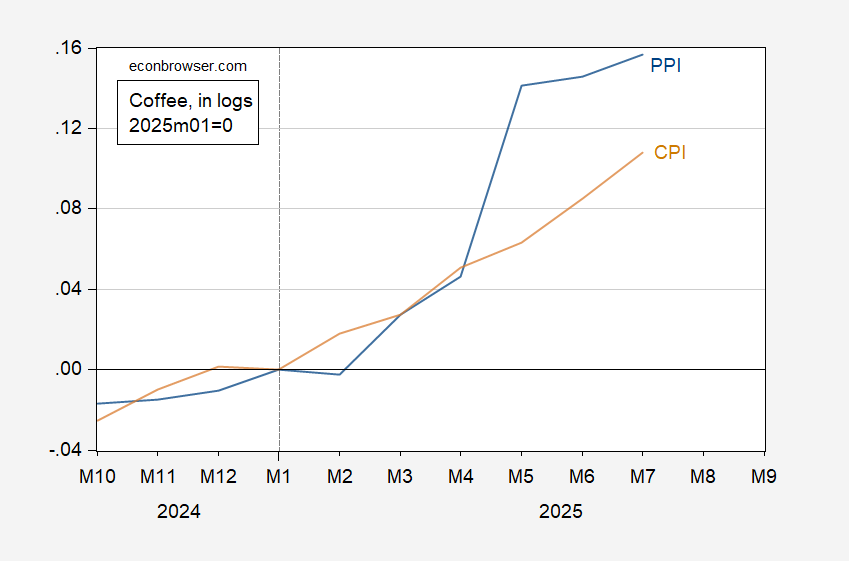
Figure 1: PPI for roasted coffee, n.s.a. (blue), and CPI for coffee, s.a. (tan), all in logs 2025M01=0. Source: BLS via FRED, and author’s calculations.
Note that near-month futures for coffee are roughly the same in July as in January. This suggests that to a first approximation, tariffs are explaining the jump in coffee prices.
In the short run, a one percentage point increase in PPI is associated with a 0.16 ppt increase in CPI. In the long run, the one percentage point increase in PPI is associated with a 0.75 ppt increase in the CPI (pre-pandemic, 2003-2019, using error correction model).
The Trump administration implemented a 10% baseline tariff on nearly all imported coffee in April 2025, with Brazil at 50% tariff as of August 6, 2025 (30% US imports were from Brazil); India at 25% tariff, Indonesia at a 19% tariff, Vietnam: at 20% tariff, and Bolivia, Costa Rica, and Ecuador at 15%.
I can hardly wait for coffee growers to produce in Wisconsin, to show the world we can compete in *all* dimensions!
More By This Author:
PPI => CPI?Michigan Survey: Sentiment Down, Inflation Expectations Up
Business Cycle Indicators – Industrial Production, Retail Sales


Comments
Log in or sign up to join the conversation.