Real 10-Year Treasury Yields: Back To The ‘Aughts?
Back to the 'Aughts?
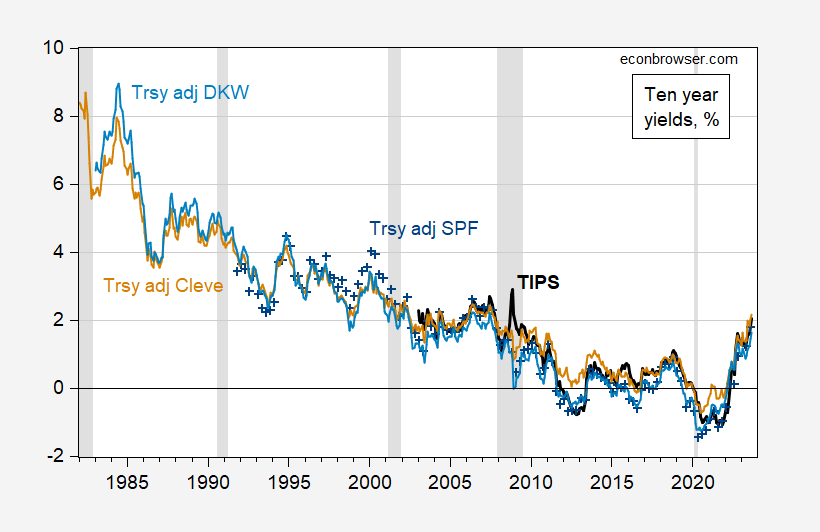
In a way, yes — that is in terms of levels. In terms of pace of change, no.

Figure 1: TIPS 10 year (bold black), Treasury 10 year minus Survey of Professional Forecasters median 10 year expected inflation (blue +), minus Cleveland Fed expected inflation (tan), minus KWW expected inflation (light blue), all in %. NBER defined peak-to-trough recession dates shaded gray. Source: Treasury via FRED, Philadelphia Fed, Cleveland Fed, KWW from Fed Board, NBER, and author’s calculations.
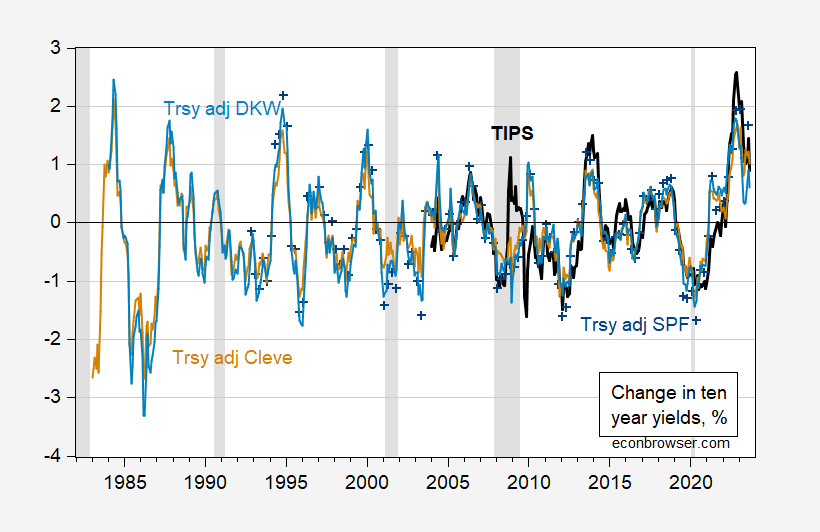
However, looking at the year-on-year change, the run-up in real rates is unprecedented was unprecedented, through 2022M11. For 24-month changes, is is currently unprecedented (over this sample period).

Figure 2: 12 month changes in TIPS 10 year (bold black), Treasury 10 year minus Survey of Professional Forecasters median 10 year expected inflation (blue +), minus Cleveland Fed expected inflation (tan), minus KWW expected inflation (light blue), all in %. NBER defined peak-to-trough recession dates shaded gray. Source: Treasury via FRED, Philadelphia Fed, Cleveland Fed, KWW from Fed Board, NBER, and author’s calculations.
While the 12-month change in the 10-year yield has moderated to about 2.3-3% from a peak of 0.9-2.4%, the annualized 24-month change is at a high of 1.5% (TIPS).
More By This Author:
The Employment Situation Release And Business Cycle Indicators
The Boom In Manufacturing Structures Investment
Quantity Theory And (Broad) Money Demand In Normal And Abnormal Times


