Monthly GDP And Coincident Index
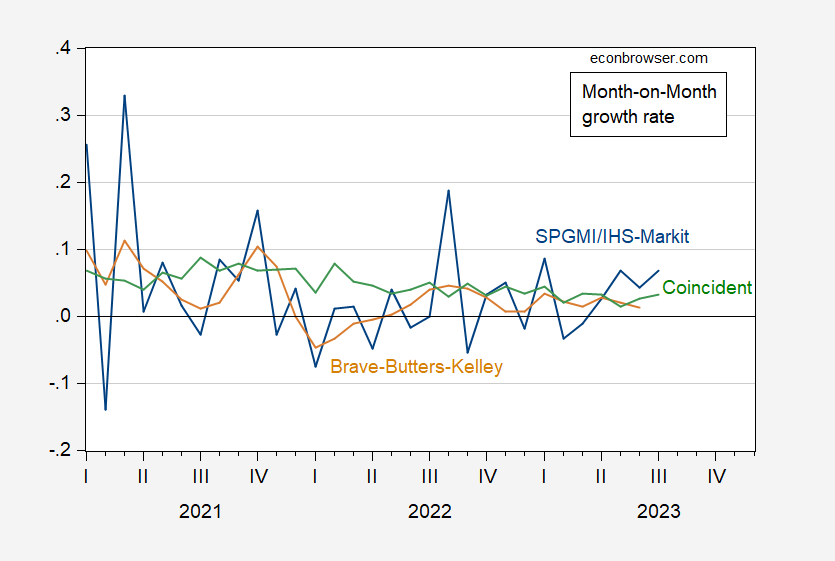
The Brave-Butters-Kelley monthly GDP for June is out. Here’re growth rates of this series compared against the SPGMI (formerly IHS/Markit) monthly GDP, and the Philadelphia Fed’s coincident index, which should track GDP.

Figure 1: Month-on-month annualized growth rate of monthly GDP from SPGMI (blue), from Brave-Butters-Kelley (tan), and from Philadelphia Fed coincident index (green). Source: SPGMI (9/1), Indiana Univ via FRED (9/5), and Philadelphia Fed (8/25), and author’s calculations.
Informal discussion of BBK here.
The preceding are backwards-looking indicators. Even the Lewis-Mertens-Stock Weekly Economic Indicator for the week ending 8/26 at 1.96% is backwards looking.
The July BBK leading indicator is in the positive range, at 1.2. That means real GDP growth is expected to be 1.2 standard deviations above trend. This is contrast to Conference Board July LEI (a combination of financial and real and expectations indicators) which declined in July and has been signalling recession for months.
More By This Author:
Mean And Median Average Hourly Earnings Growth Compared
Arguments About The Output Gap, 2017
Close To/At Target Inflation


