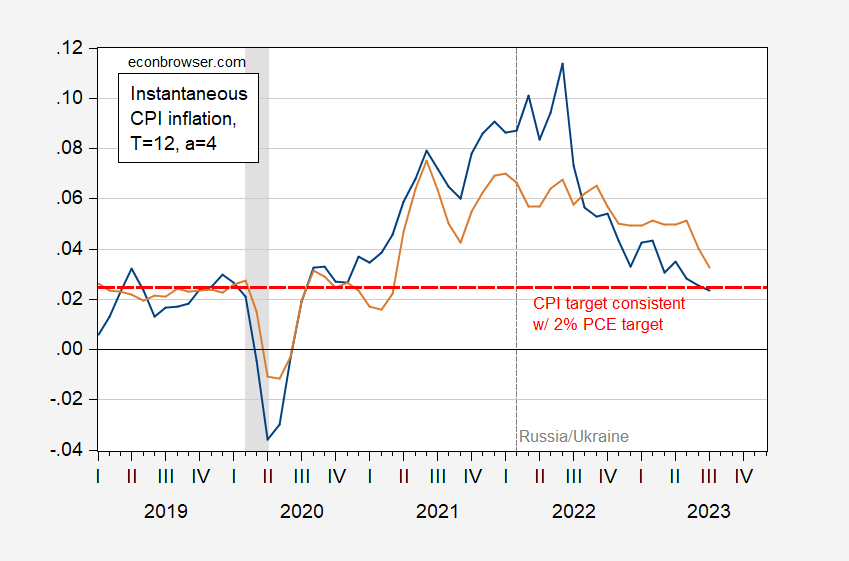
Close To/At Target Inflation

Instantaneous (Eeckhout, 2023) PCE and CPI inflation.
Figure 1: Instantaneous PCE deflator inflation (blue), core PCE deflator (tan), per Eeckhout, T=12, a=4 (bold red). Red dashed line at 2% inflation. NBER defined peak-to-trough recession dates shaded gray. Source: BEA via FRED, and author’s calculations.
Figure 2: Instantaneous CPI deflator inflation (blue), core CPI deflator (tan), per Eeckhout, T=12, a=4 (bold red). Red dashed line at 2.46% inflation which is consistent with 2% PCE inflation over the 1986-2023 period.NBER defined peak-to-trough recession dates shaded gray. Source: BLS via FRED, and author’s calculations.
Note that if we took Jason Furman’s proposal to go to 3% target, we’d already be (at 2.5%) below target. 3%, by the way, is still lower than the 4% that Blanchard considered a decade ago.
More By This Author:
What’s The Output Gap? – 2023 EditionBusiness Cycle Indicators, As Of September 1
The Employment Release, News, And Futures-Implied Fed Funds


US month CPI decreases to 0.2% according to https://www.wecobook.com/