

Image Source: Unsplash
Market Brief – Stocks Break Hard On Friday.
The market crack on Friday resulted from a defensive move as geopolitical stress, trade rhetoric, and political dysfunction triggered a sharp reversal in sentiment. After trading relatively flat most of the week, the S&P 500 fell 2.7% on Friday, wiping out earlier gains and ending the week in the red. The late-day selloff was triggered by unexpected comments from President Donald Trump, who called for a sweeping escalation in trade restrictions against China, including 100% tariffs and export controls.
The aggressive tone of the statement shocked markets already on edge due to stretched valuations and a lack of fresh economic data.
Tech and semiconductor stocks were hit hardest, which had led the advance for much of the week. The prospect of renewed trade tension with China immediately raised concerns about global supply chains, chip exports, and corporate margins. The Philadelphia Semiconductor Index dropped sharply, while megacap tech names saw heavy profit-taking. The Nasdaq, which had reached new highs earlier in the week, reversed and closed lower alongside the S&P and Dow. As we will discuss today, the magnitude of the selloff was what we have warned about for the last two weeks.
At the same time, the government shutdown continued into its second week, with no visible signs of resolution. Agencies began furloughing employees and delaying essential services, and, most importantly for markets, this includes a continued suspension of key economic data releases. The Bureau of Labor Statistics, however, did confirm that next week’s CPI report will be postponed until October 24th. It will be published just 2 days before the Fed’s next rate decision.
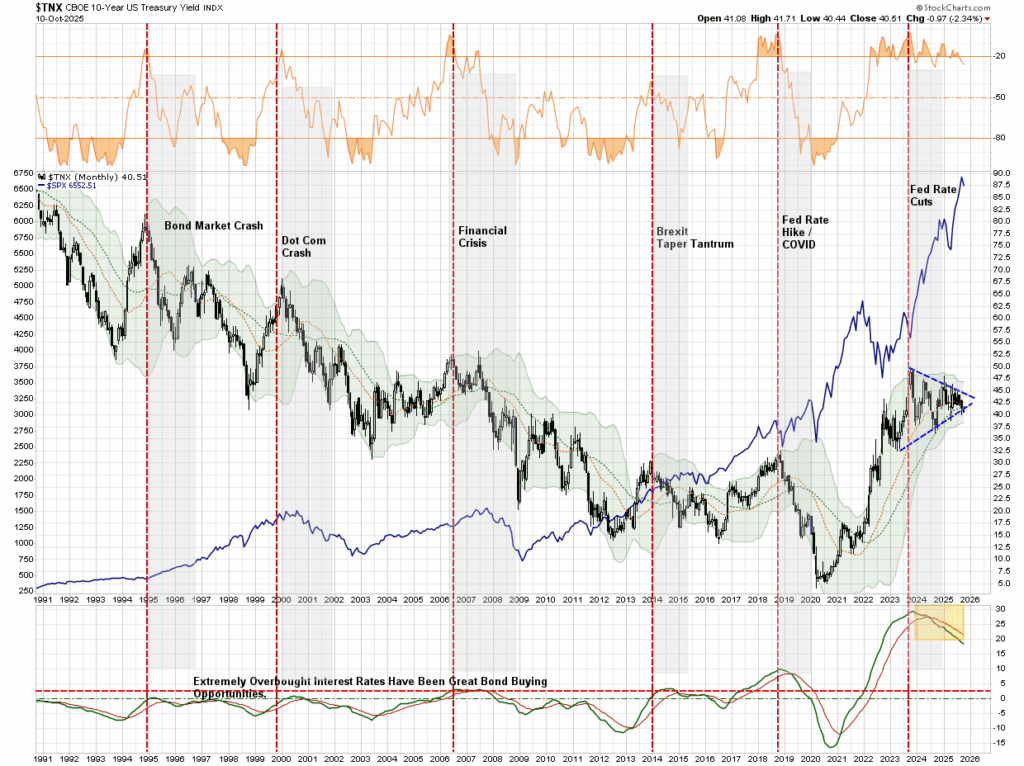
Bond yields declined sharply on Friday, as investors moved to safety amid growing uncertainty. The 10-year Treasury yield fell toward 4.05% as safe-haven demand picked up. Notably, yields are on the cusp of a long yield compression technical breakout. With yields very overbought on a monthly basis and on a technical sell signal, the technical backdrop continues to support lower yields. Given the enormous short position on US dated treasuries, a move below 4% will likely spur short-covering, driving yields lower. Such would also align with previous historical precedents.
(Click on image to enlarge)
Next week’s action is hinged on the current administration’s next move on trade. However, given the President’s previous actions and statement on Friday, I do not expect a “weekend reprieve.”
Technical Backdrop – Stocks Drop To Close The Week
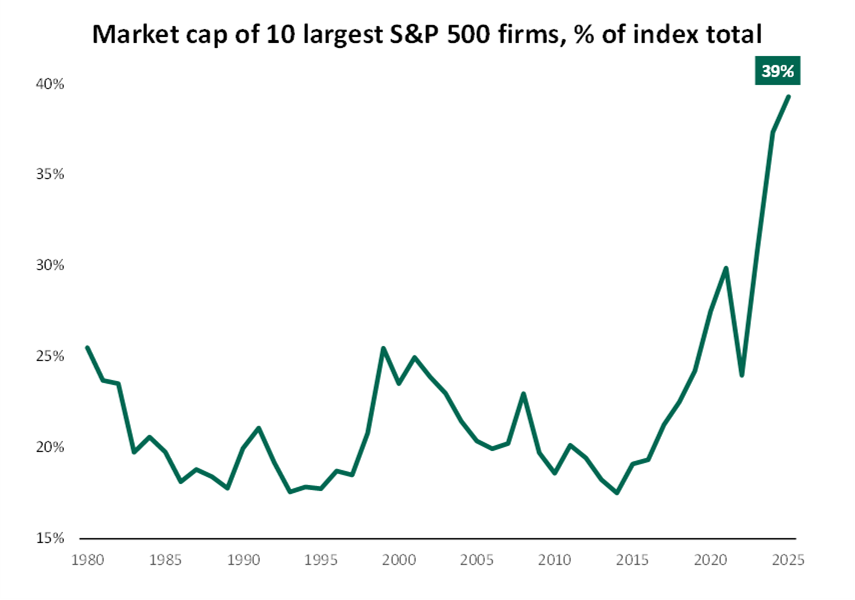
Positioning remains top-heavy. The concentration risk across the top 10 names in the S&P 500 is now at extreme levels. Valuations are stretched, and any earnings disappointment in leadership names could trigger a further repricing, particularly with sentiment optimistic. As downside risks increase, risk management becomes more key.
Markets ended the week on a sour note. After several days of narrow-range trading, the market cracked on Friday, closing 2.71% lower. That single-day move erased the week’s earlier gains and shifted the technical tone heading into next week. The index had previously maintained a record-long streak, 112 consecutive sessions, above its 50-day moving average. That trend is now threatened if selling pressure continues into early next week.
As shown, the negative divergence in relative strength warned of a potential for a sharp reversal. Momentum readings (RSI, MACD) were elevated heading into Friday, creating fragility. As noted, the drop on Friday took out the 20-day moving average, and the 50-day moving average is crucial support for next week. The sudden drop also breached the bullish trend line that has been intact since May, suggesting there is risk to the downside.
(Click on image to enlarge)

Support/resistance levels
- Near-term resistance: ~6,750, which coincides with recent market highs.
- Key support: ~6,529 or the 50-day moving average. A breach of that support could usher in further weakness.
- Deeper support: ~6,381, which aligns with market dips.
- Critical support: ~6,049 of the 200-day moving average. That level must hold, or other factors are likely at play.
Friday’s sell-off was tied to multiple catalysts. Renewed geopolitical tensions and talk of tariff escalation added a layer of macro stress. At the same time, the lack of incoming economic data due to the government shutdown has increased uncertainty. Without CPI or PPI updates, traders are flying blind on inflation and wage pressures. As noted, that vacuum creates fragility, especially when momentum is already stretched and volatility is compressed. Breadth remains narrow, with most gains still concentrated in mega-cap tech, which was also responsible for the bulk of the drop on Friday. That makes the broader market more sensitive to any weakness in leadership names. The technical picture has shifted from stable to vulnerable in just one session. Next week will be critical in determining if this is a short-term shakeout or something more.
Key Catalysts Next Week
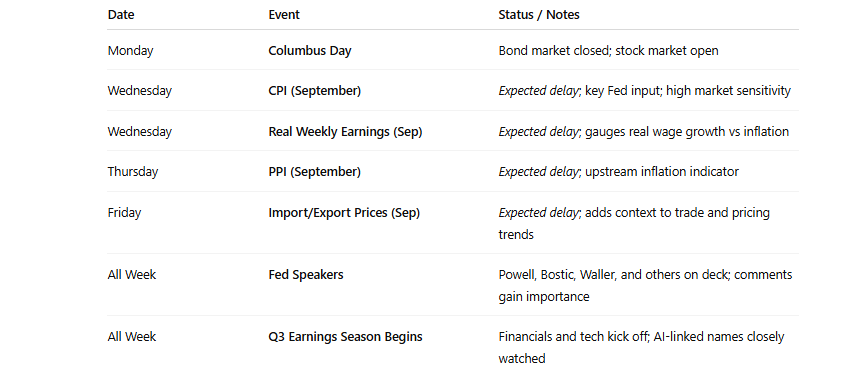
The economic calendar for the upcoming week was expected to provide critical updates on inflation and wage growth. However, due to the ongoing government shutdown, the release of major reports from the Bureau of Labor Statistics and the Census Bureau is uncertain. If not resolved by early next week, most federal economic data, including CPI and PPI, will be delayed. That removes essential guidance at a time when investor positioning is heavily dependent on a soft-landing narrative.
Below is the updated calendar, based on current scheduling and shutdown contingencies:
(Click on image to enlarge)
Markets will monitor any resolution to the shutdown early in the week. There is little hope of any resolution to the shutdown this coming week, so traders will be forced to rely on Fed guidance and earnings to interpret macro conditions. Speaking of earnings, they will likely carry more influence than usual. With macro data paused, forward guidance and margin commentary from large-cap tech, semiconductors, and banks will shape sentiment. If guidance softens or margins compress, equity markets could face pressure, particularly with positioning heavy in AI and high-beta growth.
Without inflation data, volatility could increase as investor expectations become more speculative. Rate assumptions are increasingly disconnected from policy statements. Once released, that gap may close quickly if CPI or PPI points away from disinflation. Until then, markets will be trading on limited visibility.
Need Help With Your Investing Strategy?
Are you looking for complete financial, insurance, and estate planning? Need a risk-managed portfolio management strategy to grow and protect your savings? Whatever your needs are, we are here to help.
Market Crack Or The Beginning Of Something Bigger
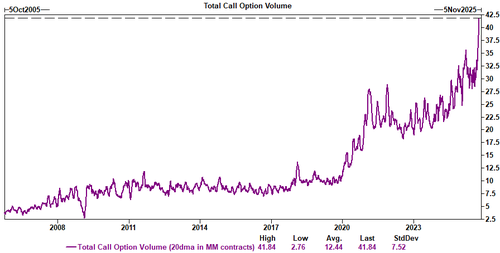
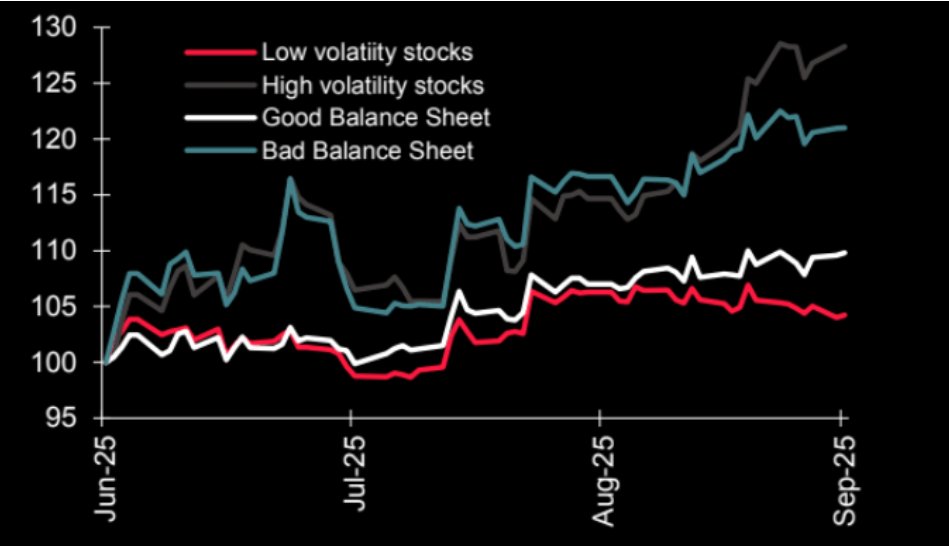
The data had been sending signals that few wanted to acknowledge all week. Speculative behavior had reached extremes, valuations were stretched, and positioning was one-sided. Retail traders had returned to chasing options and meme stocks with the same recklessness seen in 2021. As we noted previously, the speculative behavior had reached records on many levels.
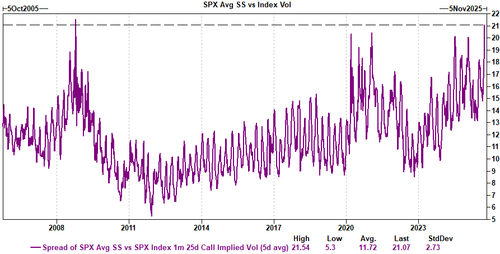
As recently noted by Goldman Sachs:
“In fact, if you look at the spread of single stock volatility to index volatility, it’s at one of the widest levels we have ever seen.”
Furthermore, systematic flows had increased equity exposure, reinforcing a feedback loop of rising prices and falling volatility. Many algorithmic trading strategies are volatility-sensitive; therefore, when markets trend upward with low volatility, these strategies increase exposure. This creates a feedback loop where price action drives further buying.
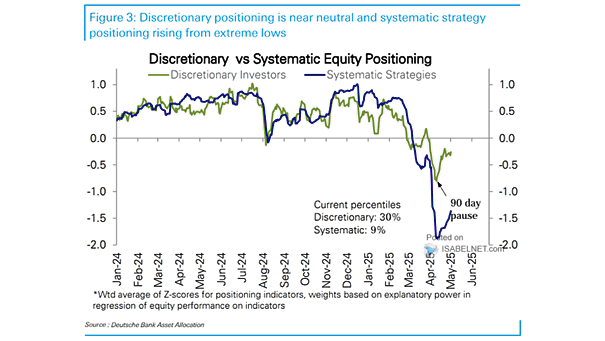
However, when volatility spikes or prices fall, the same models reverse direction and sell, potentially accelerating a downturn, which is why the market crack on Friday was so severe. In fact, we warned about the potential of this event in Friday mornings DailyMarketCommentary. To wit:
“While we are not bearish on the market currently, the risk is building that a correction will occur. Unfortunately, given the high levels of complacency and offside positioning, the selloff could be sharper than many expect. Furthermore, given the high levels of investor sentiment, a downturn of 10% will “feel” much worse than it actually is. It is in these environments where investors make the most mistakes.”
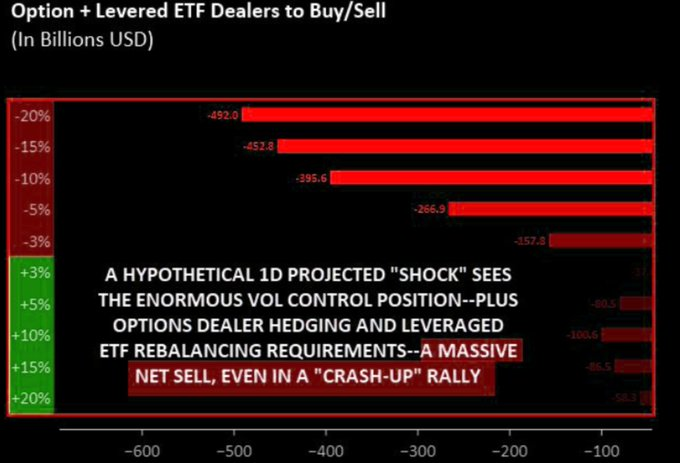
Lastly, retail trading volume had climbed significantly, focusing on leveraged ETFs and meme stocks. Many trades are based on social media narratives, not balance sheet strength or revenue forecasts. This shift in behavior to chasing poor fundamentals and high volatility stocks has historically marked peaks, not bottoms.
(Click on image to enlarge)
The setup was classic: overconfidence, leverage, concentration, and it only needed a trigger. Trump’s tariff comments became the catalyst, but the fragility was already embedded. High-growth names, semiconductors, and thematic ETFs bore the brunt. Defensive sectors caught a bid, while yields fell as traders rushed to safety.
This wasn’t a crash but a market crack that happens when everyone is on the same side of the boat. On Friday, the same crowd that had been relentlessly pushing prices higher moved in the other direction. The reason the market crack was so severe reflects our previous comments that “Sellers live higher, buyers live lower.”
“The stock market is always a function of buyers and sellers, each negotiating to make a transaction. While there is a buyer for every seller, the question is always at “what price?”
In the current bull market, few people are willing to sell, so buyers must keep bidding up prices to attract a seller to make a transaction. As long as this remains the case and exuberance exceeds logic, buyers will continue to pay higher prices to get into the positions they want to own. Such is the very definition of the “greater fool” theory.
However, at some point, for whatever reason, this dynamic will change. Buyers will become more scarce as they refuse to pay a higher price. When sellers realize the change, they will rush to sell to a diminishing pool of buyers. Eventually, sellers will begin to “panic sell” as buyers evaporate and prices plunge.”
Whether this reversal deepens depends on what comes next. Earnings, macro data (if it arrives), and liquidity could offset the fears of trade escalation. But the takeaway is clear: the market crack puts investors at risk of a deeper corrective cycle if near-term supports fail.
Was This The Beginning Of The End?
Was Friday’s market crack the beginning of the end of the melt-up phase?
That answer is probably “no.”
Paul Tudor Jones recently highlighted the dual nature of the current environment. He expects a powerful rally ahead, but also warned that we are entering the final stages of the bull market as a market melt-up ensues. While his views were that gains would be frontloaded, they would be followed by a violent reversal. Of course, such should be unsurprising, as that is how all speculative market phases and meltups eventually end.
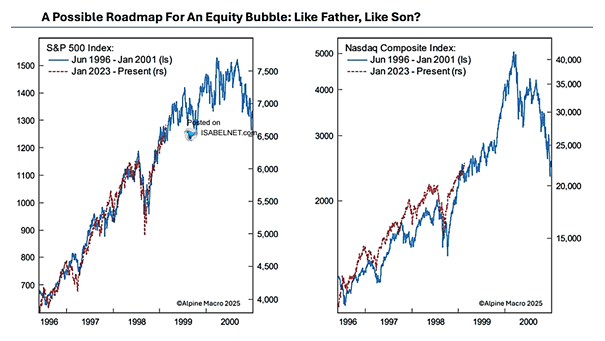
However, that does not mean markets would have some volatility along the way. As Jones noted, the final year of a market meltup often produces the most substantial gains. But even those gains tend to come with some increased volatility. We see this in the parallels to 1999 that we discussed last week. To wit:
“Every bubble has a story at its core. In 1999, that story was the internet: a transformational technology that would reshape commerce, communications, and culture. Investors saw the future, bid prices into the stratosphere, and assumed profits would inevitably follow. In 2025, the story is artificial intelligence, which carries the same irresistible promise of reshaping industries, creating productivity booms, and unlocking new frontiers. The parallels are hard to miss, along with the current price action.
Like the dot-com era, today’s market is being driven by breathtaking growth assumptions. Back then, Cisco traded north of 100x earnings on the belief it was selling the “backbone of the internet.” Pets.com and Webvan raised hundreds of millions, only to collapse when business models proved unsustainable. The psychology, then and now, is driven by the “fear of missing out.” Investors rush in because the narrative is too powerful to ignore: However, “if AI changes everything, you can’t afford not to own it.“
The market crack has likely not broken the critical tailwind of the bull market as liquidity remains abundant. Fiscal deficits are large, the Fed remains dovish, and global central banks are cutting rates. All of these support continued price appreciation, but the same ingredients that drive the melt-up create instability. That instability was made evident in the market crack on Friday.
The reversal on Friday has not broken the bullish trend, yet. For investors, the risk is not in being wrong directionally, but in timing. Such is why over the last few weeks, we have repeatedly discussed the market’s negative divergences, the risk of chasing momentum, and the offside positioning of investors in general. As is always the case, momentum markets reward participation until they don’t. When everyone is positioned similarly, reversals have no buffer, the exits are narrower, and the market cracks are larger. This is particularly the case with virtually every asset class hitting all-time highs, from large-cap stocks to international and emerging markets to gold and bitcoin.
Everyone has a “narrative” about why their particular asset of choice is rising; however, they can’t all be correct. Furthermore, the eventual reversal is also correlated when all asset classes become highly correlated.
The Risks Of Narratives
As noted, everyone has a narrative for why their favorite asset class is going higher. Leon Cooperman recently warned that we have entered the phase of the bull market that Warren Buffett feared most. He cited Buffett’s warning:
“Once a market reaches the point where everyone makes money regardless of strategy, the crowd shifts from rational investing to fear of missing out.”
In Cooperman’s view, earnings or interest rate dynamics no longer support the rally; it is just the price action itself. Investors are buying only because prices are rising. That kind of behavior never ends well. As he discussed, valuations, like the Buffett Indicator, and crowd behavior, are key reasons for concern. The Buffett Indicator, the ratio of total market capitalization to GDP, has crossed 200 percent. That level exceeds historical extremes, suggesting that the tether between equities and the real economy broke.
Furthermore, Simon White at Bloomberg recently noted that we have entered the “Bad News Is Good News” regime.
“At the end of a stock-market rally, just before a consolidation or a correction, there is typically a period where the market reacts positively to bad news. That’s a regime we just entered.
Calling a precise top is a mug’s game, but it is often quite clear when a market is in the process of making a top. There are several reasons to think that is the case today, and we now have another one to add to the pot. Towards the end of uptrends, stocks typically start to react positively even to bad economic news. This is generally due to the reaction function of the Federal Reserve, where the market assumes it is more likely policy will be loosened as the economy weakens so, somewhat perversely, the equity market ignores the slowdown and rallies on the expectation of looser financial conditions.”
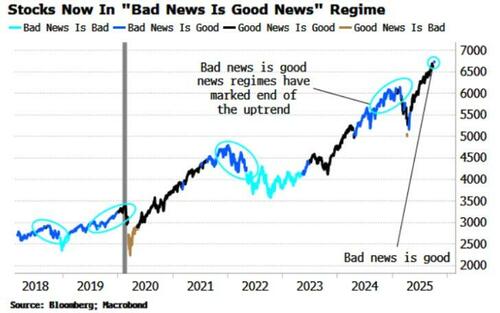
As he concludes:
“Previous times around the last three major market tops, this regime has been in play. It is often preceded by a “good news is good news” regime (white line in chart), where stocks intuitively rally when it looks like the economy is strengthening. If we roll the chart further back, it shows the “bad news is good news” regime was in play before the 2011 and 2015 tops, too.
However, there are a couple of caveats. Firstly, as we can see above, the “bad news is good” regimes can last for several months before the market corrects. This time could be no different. Secondly, in the 2000s and 2010s there were several periods where the “bad news is good” regime came mid-cycle, ie, in the middle of the rally.
It’s possible that’s the case today, but with potentially huge overinvestment in the AI sphere, all-time high valuations, and increasing signs of speculative froth, you wouldn’t want to bank on it.“
As we saw on Friday, small shocks can create significant price moves in these environments when fundamentals no longer anchor pricing. Bob Farrell once noted that crowd behavior is naturally unstable; “when all experts agree, something else tends to happen.”All the “experts” and investors expect higher prices on everything.
That one-sided bias, and most importantly, “rationalized narratives” to justify overpaying for an asset, increases the probability that even minor disappointments cause outsized reactions.
This is not about fear. It is about risk math. Expected returns are lower, volatility is rising, and the asymmetry now favors caution.
Portfolio Tactics For Next Week
The current market crack offers an opportunity for investors to reevaluate their risk exposure. If your portfolio was down substantially more than the market on Friday, you likely have too much risk. Of course, such is not surprising when the fear of missing out drives participation more than fundamentals. However, even with these cracks along the way, the bullish trend remains intact for now, and I am reasonably sure that Friday’s sell-off has not ended the speculative mania, at least not yet.
However, as noted, there is certainly risk, which is more elevated today than on Thursday. Therefore, if you want to continue participating in the market without exposing your capital to extreme downside, you must adopt more disciplined portfolio tactics.
- Scale exposure: Enter trades in tranches. Exit in steps. Avoid all-in bets.
- Use optionality: Buy calls, not full equity positions. Capture upside. Limit downside.
- Favor liquid, quality momentum: Stay with strong names. Avoid speculative microcaps.
- Add diversification: Own some gold, short volatility exposure, or trend-based funds.
- Watch for triggers: Monitor volatility, credit spreads, and macro shocks. If any trigger, reduce risk.
- Keep cash ready: Liquidity is your edge in downturns.
- Use time-based exits: Don’t wait for losses. If your position stalls, reallocate.
- Adjust position size: As volatility rises, reduce exposure.
Risk management is not a defensive tactic but a return maximizer when cycles shift. Markets change quickly, and those with a plan preserve capital and opportunity.
Trade accordingly.
(Click on image to enlarge)

More By This Author:
Corporate Profits: A Reading Without Rose-Tinted Glasses
The AI Trillion Dollar Question
Excess Liquidity: Where Art Thou?


Comments
Log in or sign up to join the conversation.