Lower Soybean And Corn Crops Keep US Ending Stocks Historically Tight
Market Analysis
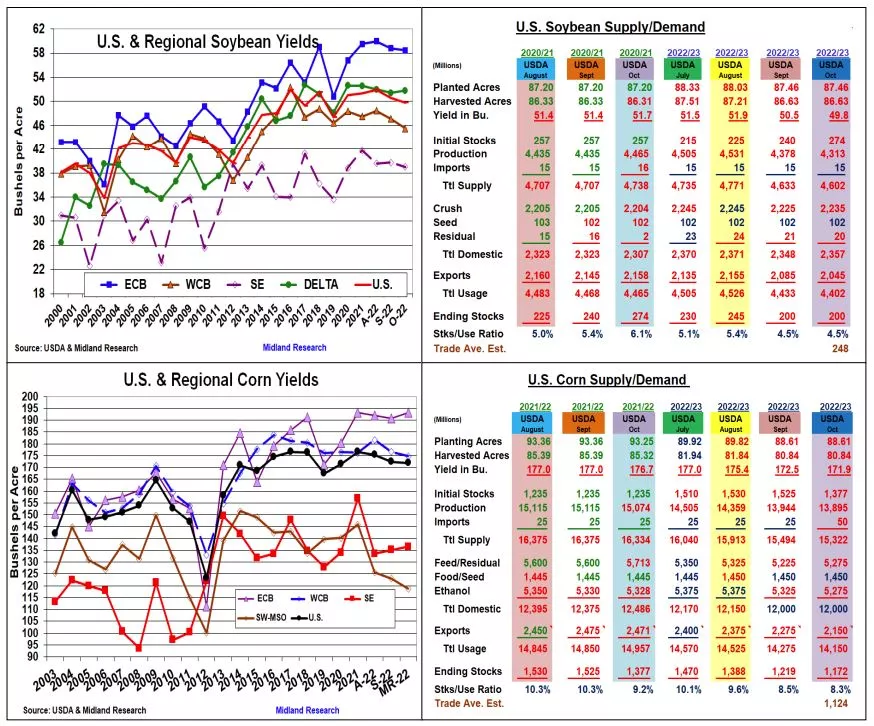
The USDA again had a curveball in its October US crop and supply/demand updates. Instead of a steady to higher US soybean yield, this month’s forecast was down. This cut this year’s crop size and tighten 2023’s stocks back to last month’s level even with 34 million higher beginning stocks. USDA NASS also slimmed corn’s yields, but their modest decline kept new crop’s stocks above the trade’s average estimate. After wheat’s Small Grain crop reduction on Sept 30, the USDA sliced exports and feed demand keeping 2022/23 stocks above the trade’s expectations, too
This month’s 0.7 bu decrease in soybeans US yield to 49.8 bu wasn’t on the radar. The W Midwest average yields were down 1.3 bu lead by KS (-4), NE (-3), MO(-2) & IA (-1 bu) declines because of last summer’s dryness. The SE US also slipped 0.7 bu with NC and GA yields off. The unexpected average decline was in E Midwest with IN and OH’s 1 bu drops taking 9 million bu from the region. Overall, this month’s 65 million lower US soybean output compensated for September’s higher carryover and lower exports (-40 million). This kept 2022/23’s ending stocks at 200 million bu — the same as September vs the trade’s 248 million bu estimate.
The markets were looking for a smaller Oct corn yield, but the modest 0.6 bu US decline produced just a 49 million lower crop. Ongoing dryness in C & S Plains dropped SD (-8), KS (- 7), NE (-4) & TX (-4 bu) yields sharply, but IL‘s dramatic 6 bu jump in its corn yield to 210 countered these reduced supplies in the West. The USDA did sliced 50 million from ethanol, but upped feed demand by 50 after last summer’s increase. The sluggish start and a high US Dollar also prompted the USDA to cut exports by 125 million. However, 2023’s ending stocks were still decreased by 47 million to 1.172 billion; the 2nd lowest carryover since 2012. Last month’s smaller US 2022 wheat crop countered higher EU and Canadian crops, but the strong US dollar prompted the USDA to drop exports by 50 million: similar to other major US crops. The US ending stocks are forecast at 576 million (down 34 million from Sept), but remain the lowest since 2009.

What’s Ahead:
Despite corn & wheat US stocks being over the trade expectations, all 3 US major crop stocks are near their historic lows. An escalating Black Sea military conflict & ongoing dryness in Argentina & the US Plains remain important price factors. However, reduced trade activity from world recession fears continues overhead.
Move sales to 65% at $14.25-45, $7.25-40, $9.80-95 and $10.75-10.95 KC.
More By This Author:
Pre-October USDA Crop Production And Supply/Demand Report
Lower US Wheat Output And Smaller Corn Stocks
US Wheat Crop/Stocks Update
Disclaimer: The information contained in this report reflects the opinion of the author and should not be interpreted in any way to represent the thoughts of any futures brokerage firm or its ...
more


