
Watch the video extracted from the WLGC session before the market open on 9 Apr 2024 below to find out the following:
-
How to interpret the change of character bar and the structure context to anticipate the next move
-
The key indicators suggesting potential exhaustion of bullish momentum in the S&P 500
-
The strong industry groups you should focus on instead.
-
And a lot more...
Market Environment
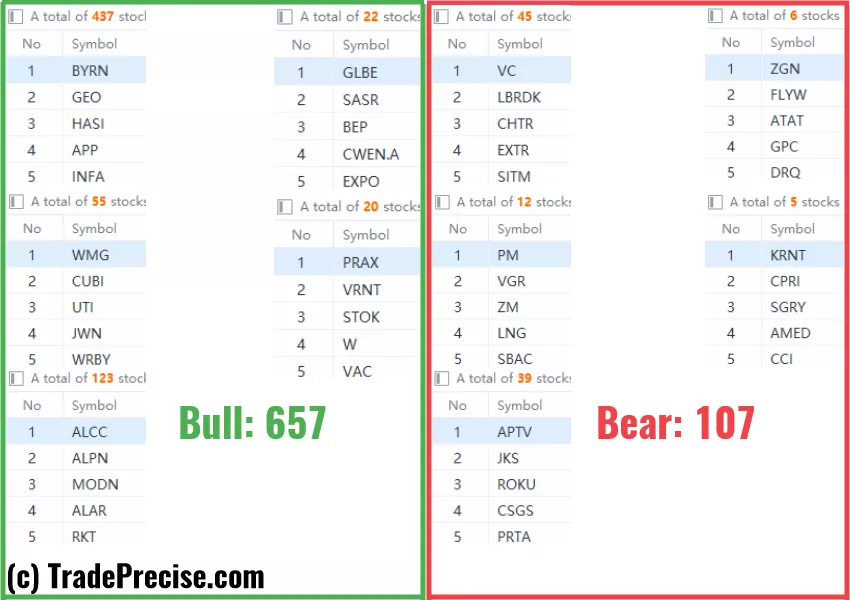
The bullish vs. bearish setup is 657 to 107 from the screenshot of my stock screener below.
Commodities like copper, and crude oil continue to outperform with strong follow-through in individual stocks.
(Click on image to enlarge)
Market Comment
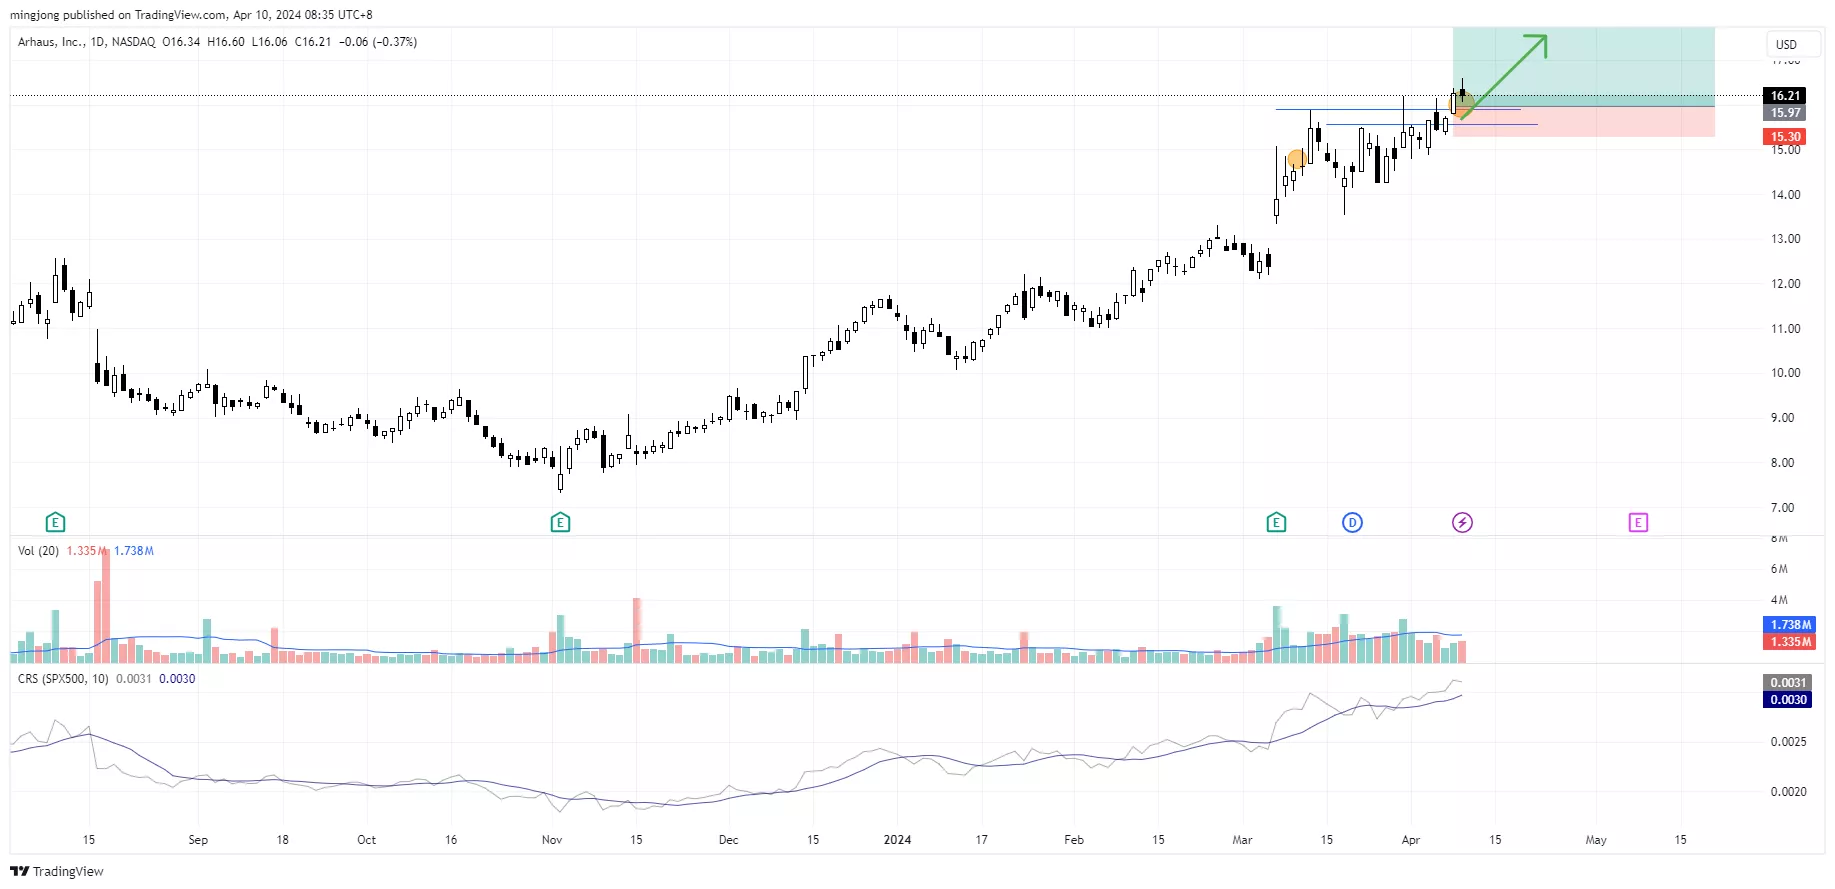
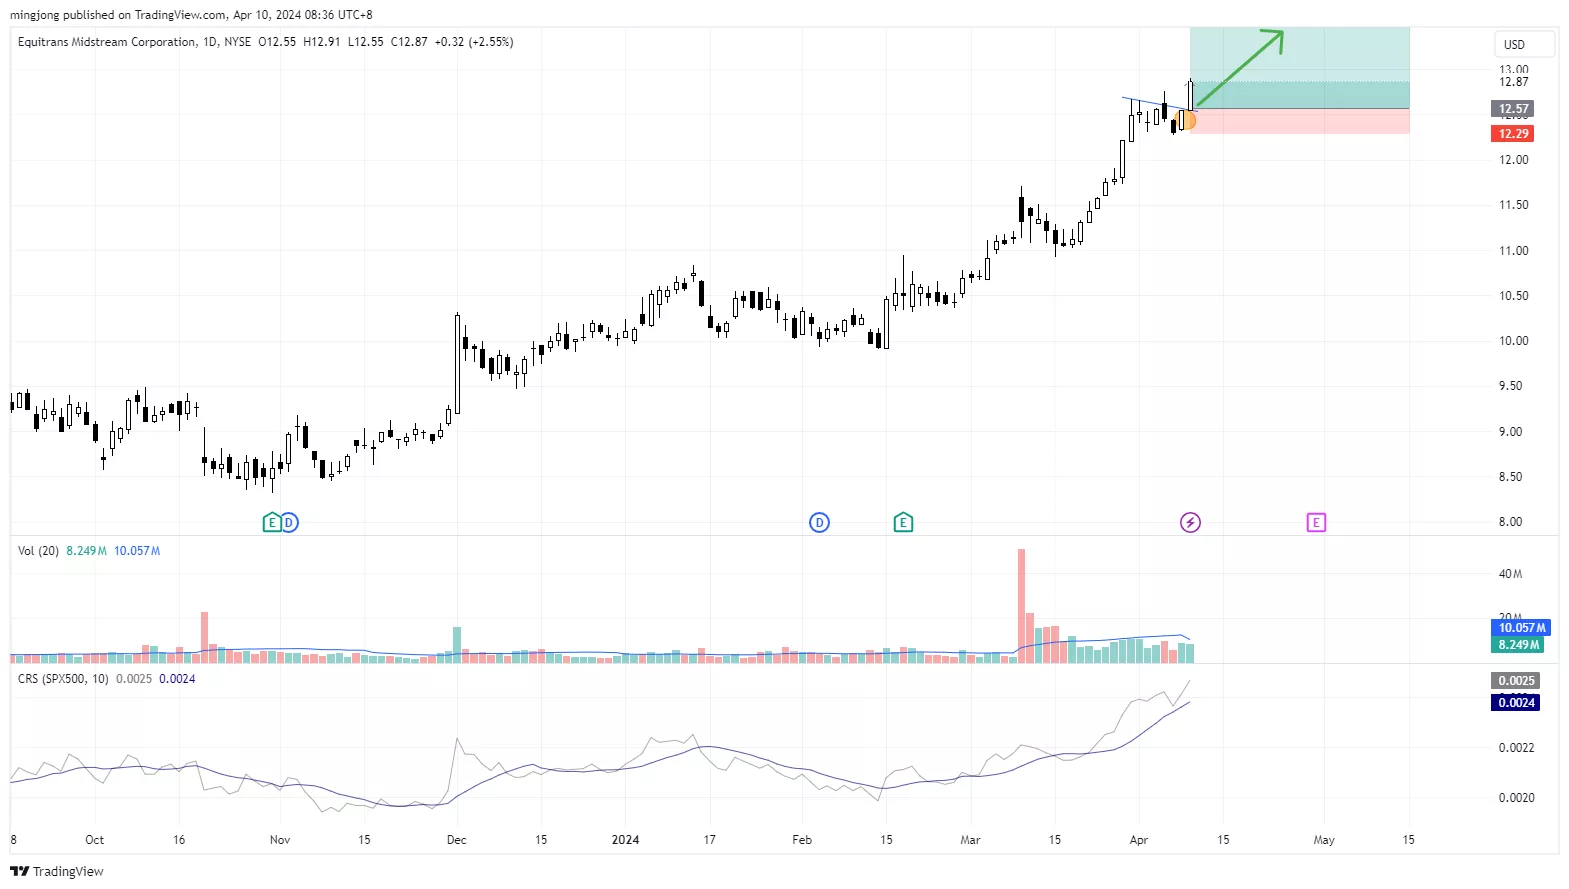
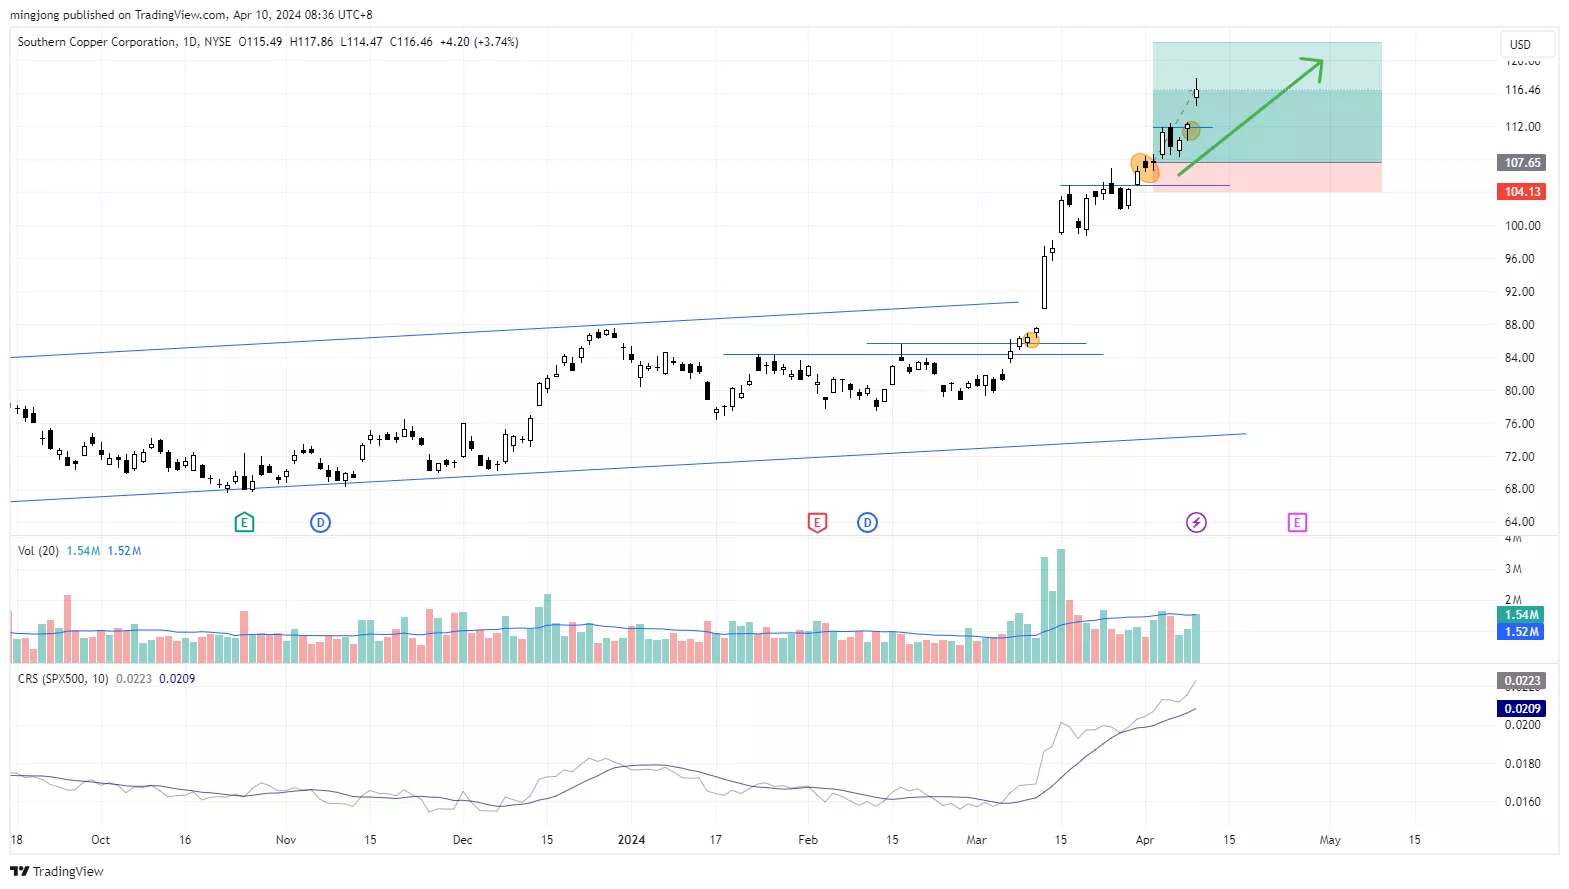
18 “low-hanging fruits” (ARHS, ETRN, etc…) trade entries setup + 11 actionable setups (SCCO etc…) have been discussed in the premium video (32:14) below the paywall accessed by subscribing members.
(Click on image to enlarge)
(Click on image to enlarge)
(Click on image to enlarge)
More By This Author:
This Demand Zone In S&P 500 Needs To Hold
Crude Oil Poised For Bullish Breakout From Wyckoff Accumulation Pattern
Toppish Pattern Or A Rally In The Making For S&P 500?


Comments
Log in or sign up to join the conversation.