

Image source: Pixabay
Watch the video extracted from the WLGC session before the market open on 19 Mar 2024 below to find out the following:
- The key support S&P 500 needs to hold to grind up further
- The signs of exhaustion of the momentum
- The red flag as been showing up in the past few weeks.
- and a lot more...
Video Length: 00:03:50
Market Environment
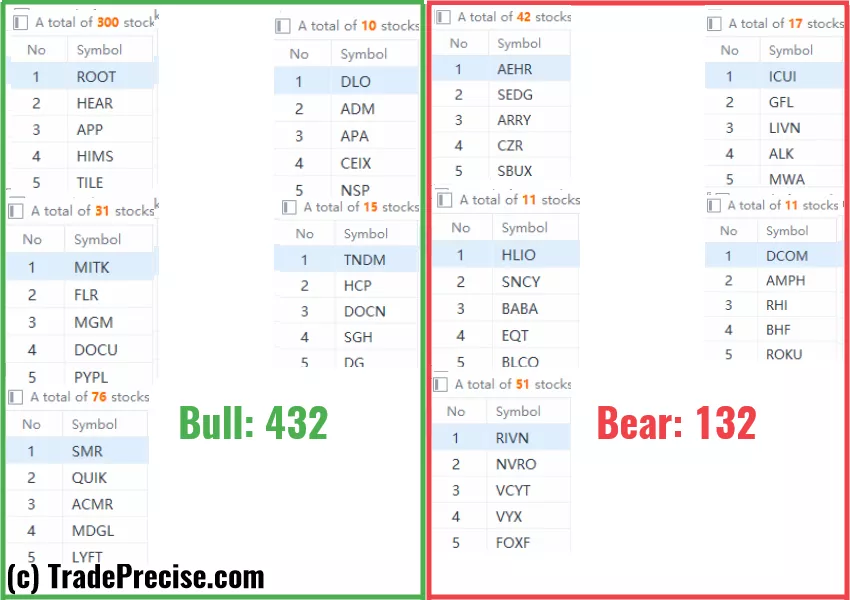
The bullish vs. bearish setup is 432 to 132 from the screenshot of my stock screener below.
Despite the decrease of the bullish setup compared to last week’s, there are still plenty of trade entry setups in the making.
Market Comment
Both the minor level and the key support level as discussed in the video play a key role in the S&P 500’s uptrend. As long as it is staying above the level, it could still grind up further.
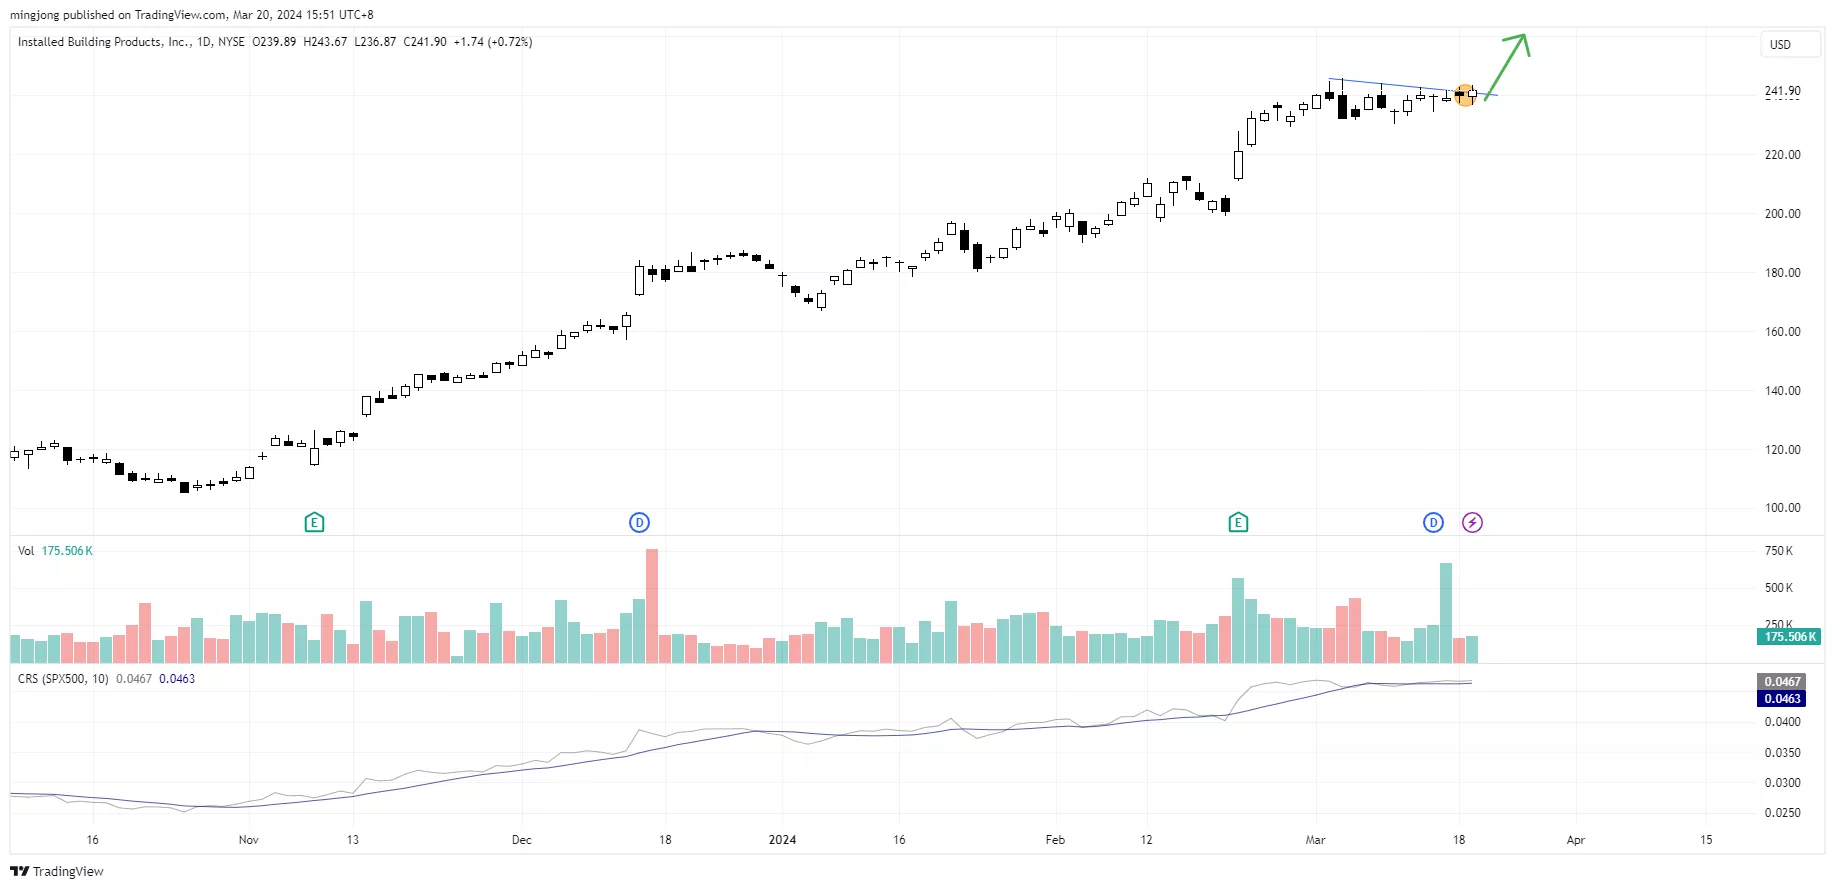
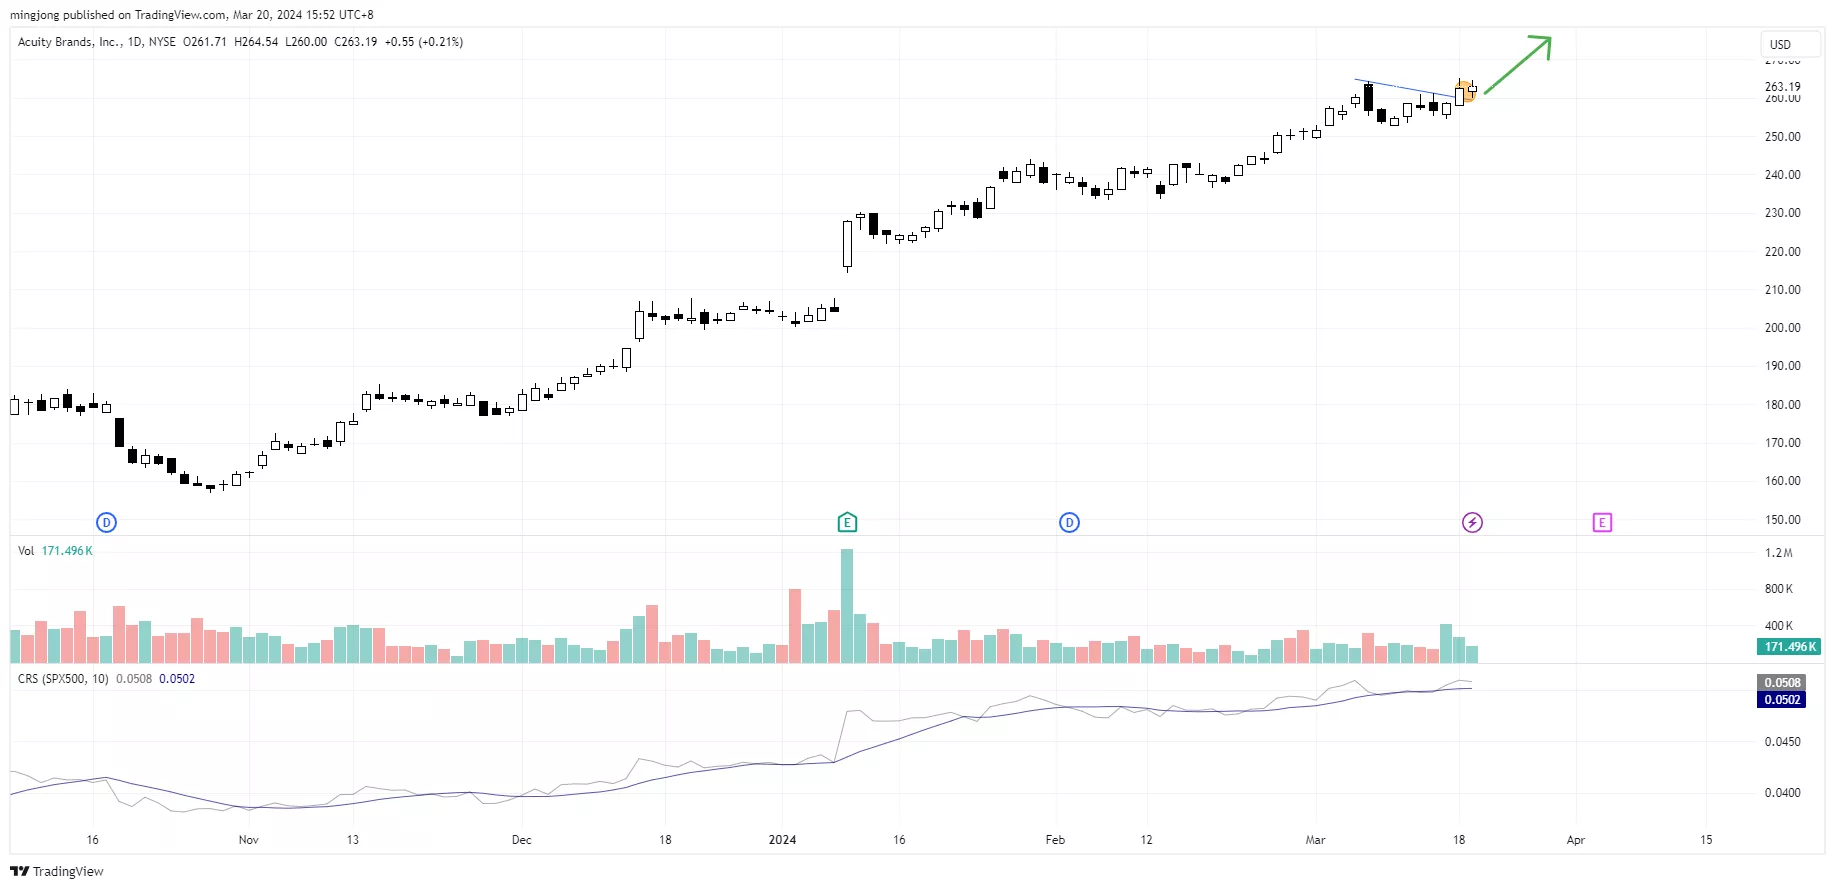
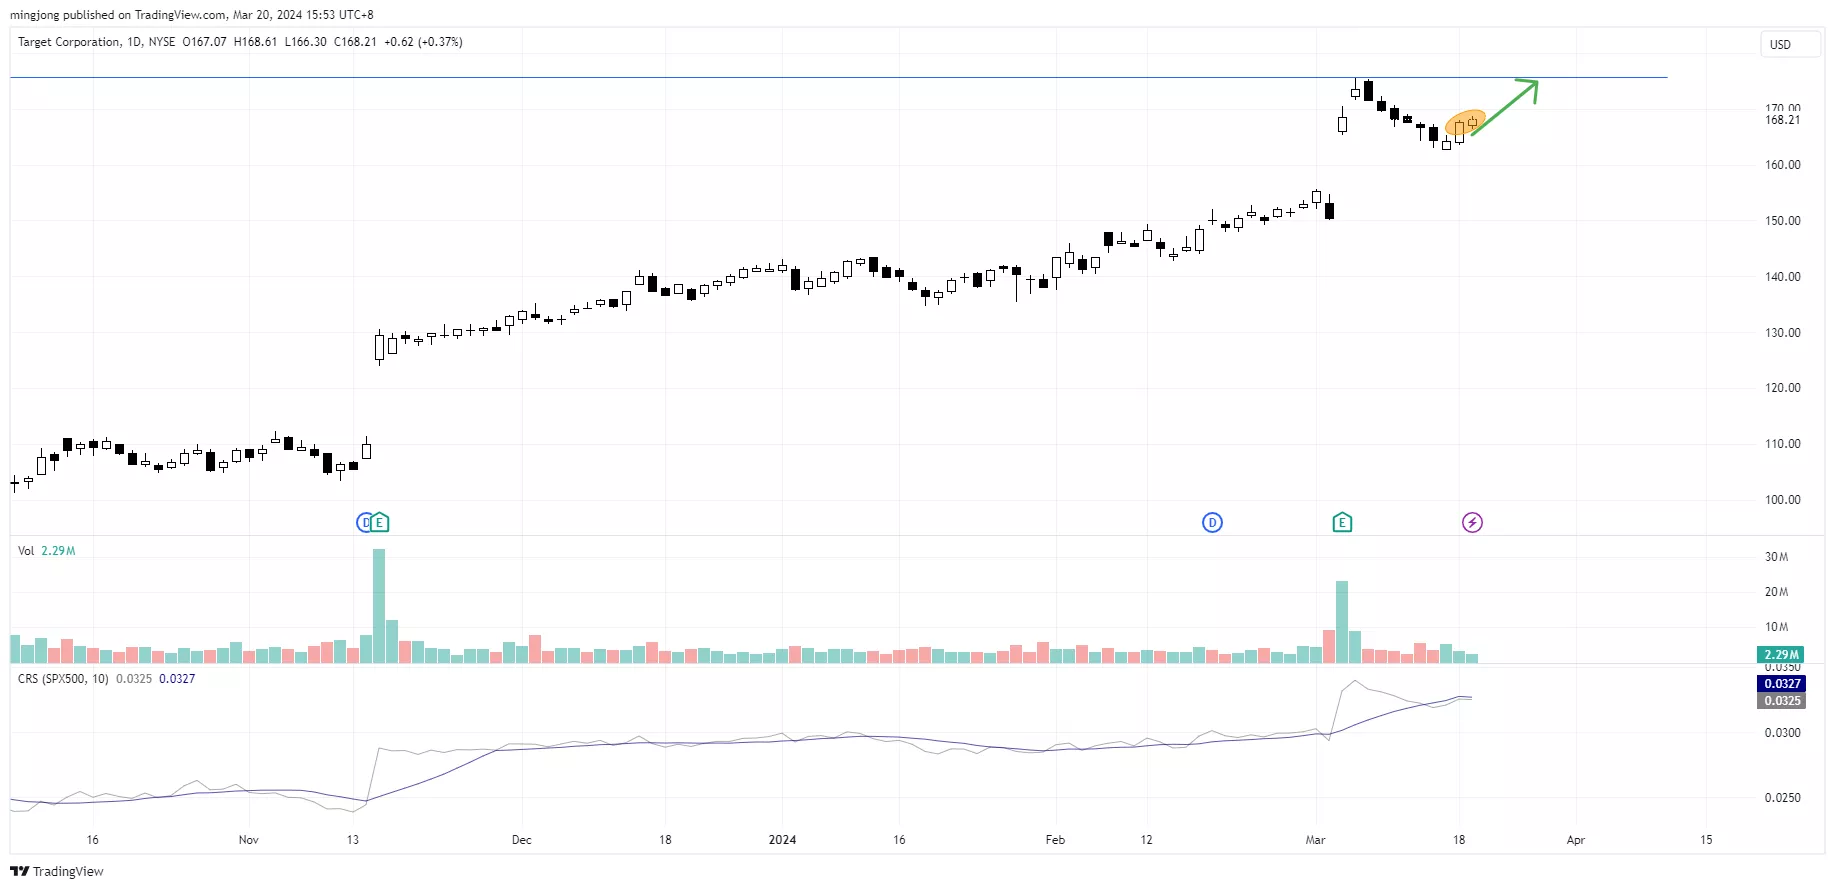
8 “low-hanging fruits” (IBP, AYI, etc…) trade entries setup + 18 actionable setups (TGT etc…) have been discussed during the live session before the market open (BMO).
(Click on image to enlarge)
(Click on image to enlarge)
(Click on image to enlarge)
More By This Author:
Will S&P 500 Grind Higher Or Face A Dramatic Shakeout?
Looming Threat Of A Rising Wedge
The NVDA Earnings Effect And What It Means For The Current Market Momentum


Comments
Log in or sign up to join the conversation.