
Tensions in the markets are increasing. Interest rate hikes, the rise in the U.S. dollar, the energy crisis in Europe, and signs of recession, are just some of the indicators that could point to further price declines.

At the same time, the month of October, which has just begun, saw two of the most spectacular crashes of all time, in 1929 and 1987.
Let us therefore take a closer look at October from a seasonal perspective. Is it predestined for tensions to be unleashed in the form of sharp price declines?
October under the seasonal magnifying glass
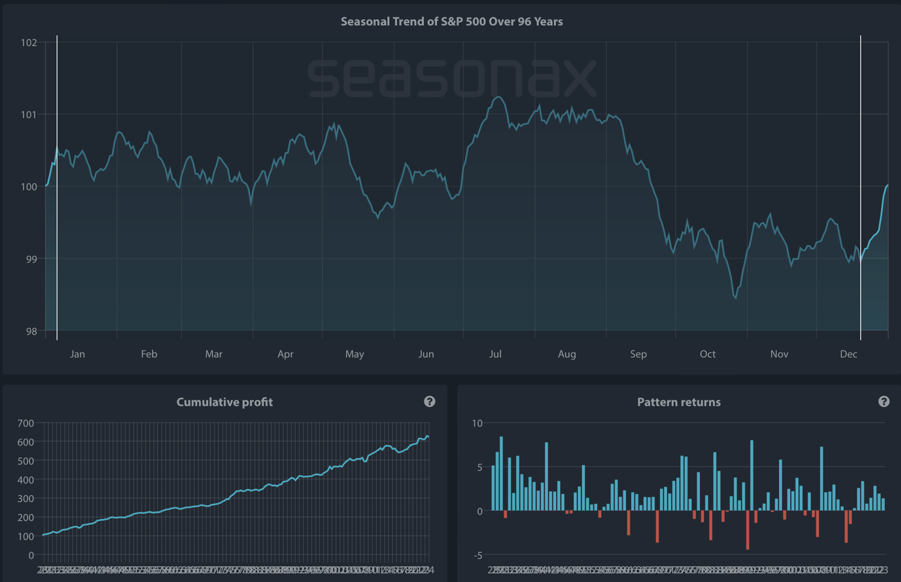
Take a look at the very long-term seasonality of the Dow Jones over more than a hundred years in the seasonal chart. It was calculated from the average of the returns of the years starting in 1898, and shows the typical seasonal pattern of the Dow Jones. The horizontal axis shows the point in time in the year, the vertical axis the level of the seasonal index.
Dow Jones, seasonal trend, determined from 1898 onwards

October is not inherently weak. Source: Seasonax
I have marked October, the phase from September 30 to October 31, in dark blue in the seasonal chart. In that month, the Dow Jones rose marginally on a seasonal basis. The average gain over the past 124 years was 0.13%. From this perspective, October is seasonally unremarkable.
But then, how is that October is considered a crash month?
In individual years, the market falls sharply in October!
A detailed analysis shows that the seasonal phase between September 30 and October 31 was positive for the Dow Jones in 70 of 124 cases, i.e. the majority of years.
What is striking is that in the winning years the gain in this season averaged 3.94%, while in the losing years the loss was a higher 4.68%.
In October, therefore, there were more increases than decreases. However, the latter were stronger. Let's take an even closer look at the facts.
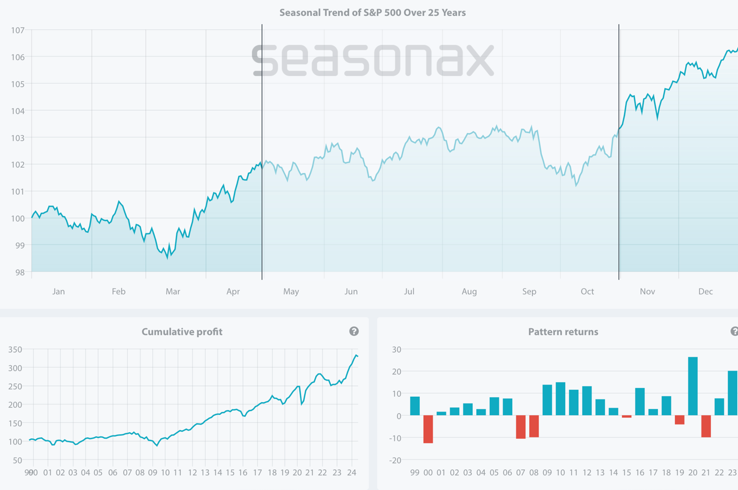
The bar chart shows you the return of the Dow Jones between September 30 and October 31 for all years since 1898. In green you see the years in which there were gains, in red the years in which there was a loss.
Dow Jones, return in percent between Sept. 30 and Oct. 31, in individual years since 1898

Several times the prices crashed in October! Source: Seasonax
Now you can see the reason why prices fell on average in October, even though there were more rises than falls. There were several price falls: for example in 1929, in the wake of the crash, by 20.36%; then in 1987, in the wake of another crash, by 22.42%; and then in 2008, in the wake of the financial market crisis, by 14.06%.
Thus, although October is a month with a sideways trend, sharp downward movements occurred on rare occasions, but nevertheless in individual years.
More By This Author:
Are Luxury Stocks Recession-Proof?
Are “Summer Stocks” Worth Buying During The Summer?
Even The Stock Market Enjoys Spring Weather

Comments
Log in or sign up to join the conversation.