
This past Friday was Groundhog Day, and Punxsutawney Phil did not see his shadow, which means early spring rather than six more weeks of winter. However, his success rate is apparently only 40%.

Still, that’s better than a baseball player, where a 30% success rate puts you in the All-Star game. After the release of the January Employment Situation report, it must have felt like Groundhog Day for the U.S. Treasury (UST) market.
What exactly do I mean by my last statement? Well, a year ago, the money and bond markets were anticipating an imminent recession and counting on weakening labor market data to do the job for it (no pun intended). Heading into 2024, a similar narrative has been adopted, with expected softening in the jobs data leading the way to either a recession or a very sluggish growth setting, at a minimum. It’s only one month into the new year, but you get the feeling it could be happening all over again.
Once again, I want to reiterate that we only have one month’s worth of data for 2024, and the January jobs report did contain revisions to both the household and establishment surveys. Sometimes, these annual revisions can make comparisons a little murky. However, there is one area where these revisions occurred that does bear closer scrutiny: job growth.
U.S. Total Nonfarm Payrolls—3-Month Moving Average
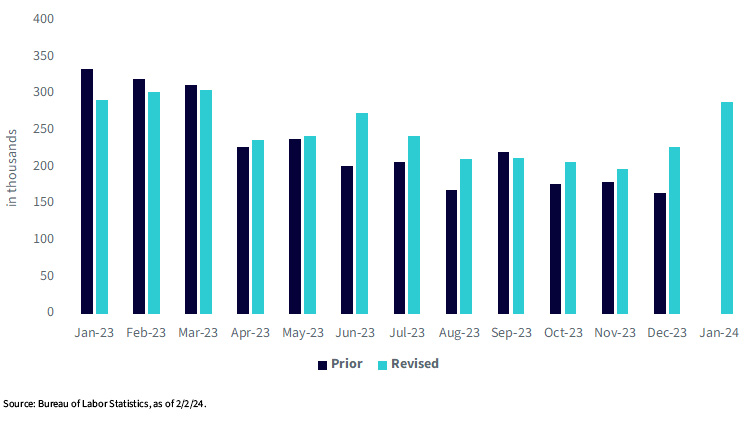
Specifically, I am referring to the adjustments to total nonfarm payrolls, where comparisons can be made to what was originally reported versus the “new” numbers. Heading into the January release, there had been some conjecture that the annual revisions could potentially reveal a slower pace of new job creation. Taking a look at the final six months of 2023, just the opposite occurred. The average monthly gain in payrolls was revised up by 27,000.
But, what I really wanted to call your attention to was what transpired in the final three months of last year, using the three-month moving average as our guide. Typically, using the three-month moving average gauge, you can smooth out any monthly volatility and theoretically get a more accurate picture of ongoing trends. As you can see in the above bar chart, the pace of new job creation post-revisions is now noticeably above the original levels. For December, the difference is rather striking as the increase now is pegged at +227,000, or more than 60,000 above the original tally of +165,000. This is a potentially important development because it shows how the momentum in job growth was picking up steam to end 2023, rather than just holding status quo as was first reported. In addition, it looks as if this momentum was carried into the first month of the new year as the three-month moving average for January rose by over 60,000 again to +289,000.
Conclusion
Once again, it is still early, and I don’t want to get overly excited about one month’s worth of data. However, these are the results both the UST market and the Fed are now presented with. At a minimum, it seems reasonable to conclude that this jobs report, at least at this time, will more than likely confirm Powell’s “base case” of no rate cut in March.
More By This Author:
Focus On The Fed Series: Global EquitiesFed Watch: Not So Fast, My Friend
One Year Later: Recapping Quality Growth In 2023


Comments
Log in or sign up to join the conversation.