
Finding Guidance From The Latest CoT Report
Following futures positions of non-commercials are as of February 1, 2022.
10-year note: Currently net short 274.9k, up 10.2k.
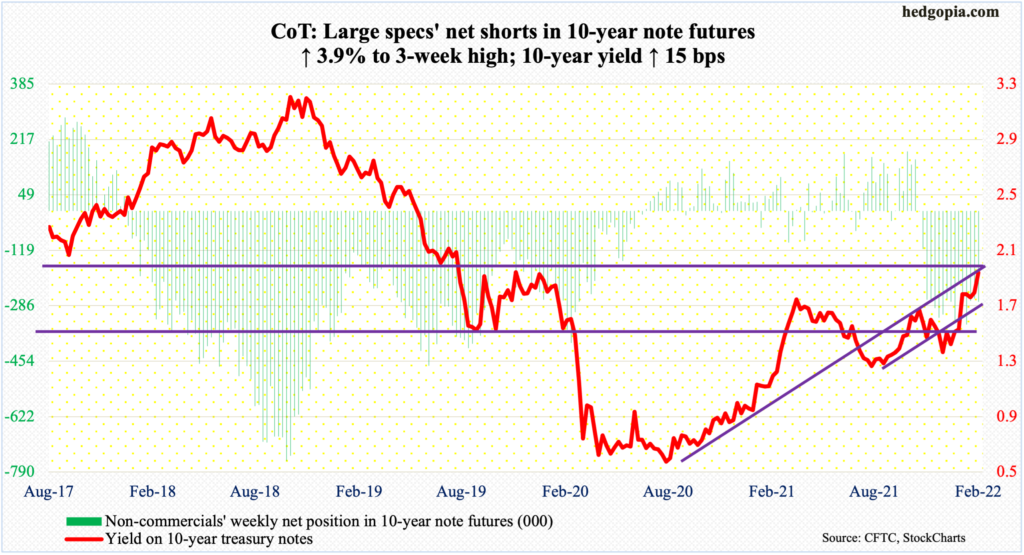
Last Wednesday when the FOMC concluded its meeting and Fed Chair Jerome Powell announced there was “quite a bit of room” to hike rates, the 10-year treasury yield jumped seven basis points to 1.85 percent. A couple of sessions before that, bond bears (on price) essentially defended breakout retest at 1.70 percent.
On Wednesday this week, bond bears once again got active as the 10-year tagged 1.74 percent before rallying. Last March, yields ticked 1.77 percent before coming under tremendous pressure; the 10-year did not bottom until July when it hit 1.13 percent. The March high was only surpassed on January 18, with a two-year high of 1.87 percent on the 19th.
On the back of January’s much-better-than-expected jobs report, rates jumped a full point on Friday to take out last month’s high to 1.93 percent. As things stand, a rally to two percent – or thereabouts – can begin to attract new funds into these notes. A decisive takeout of two percent, however, will be a major victory for the bears.
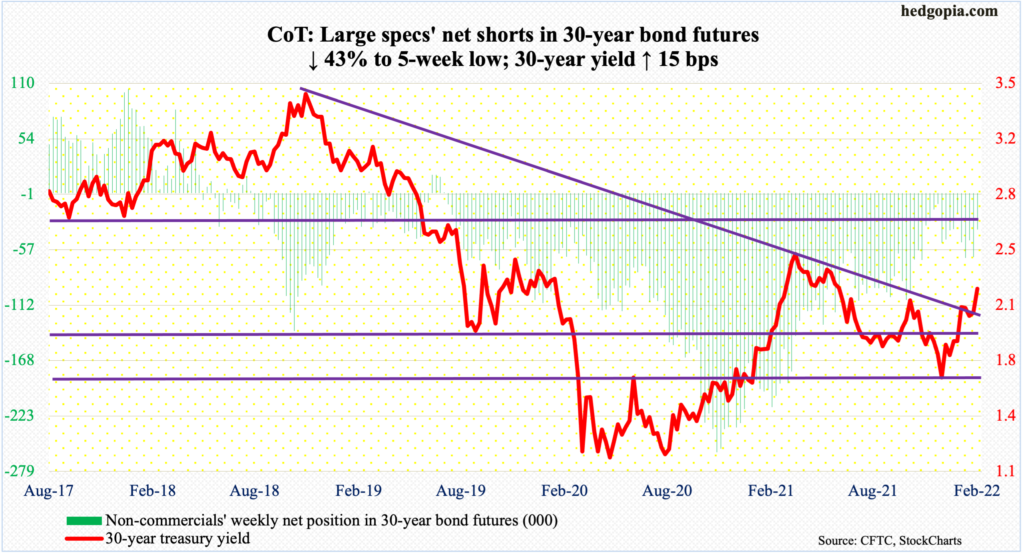
30-year bond: Currently net short 36.5k, down 27.5k.
Major economic releases for next week are as follows.
The NFIB optimism index (January) will be reported on Tuesday. In December, small-business job openings edged up a point month-over-month to 49. The sub-index hit a record high 51 last September.
Thursday brings the consumer price index (January). Headline and core consumer inflation in December rose 0.5 percent and 0.6 percent m/m. In the 12 months to December, they jumped seven percent and 5.5 percent, which is the steepest pace since June 1982 and February 1991 respectively.
The University of Michigan’s consumer sentiment index (February, preliminary) comes out on Friday. Sentiment slid 3.4 points in January to 67.2 – a decade low.
WTI crude oil: Currently net long 367.6k, down 3.9k.
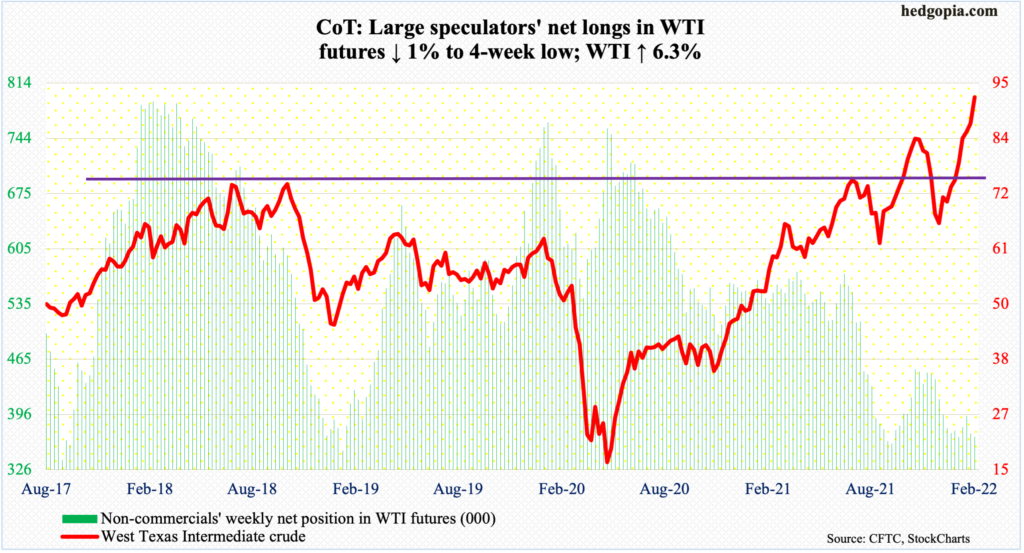
Oil traders liked what came out of this week’s OPEC+ meeting. High prices and strong demand failed to convince the group to increase production. For next month, they are sticking with the existing plan, set last July, of production increase of 400,000 barrels per day. Of late, the producers are failing to even meet their production quota.
This further added to momentum. WTI ($92.31/barrel) rallied 6.3 percent this week – its seventh consecutive up week. On December 2, the crude made a low of $62.43. Intraday Friday, it ticked $93.17, having broken out of $85 two weeks ago. This week, Monday’s low of $86.34 was the closest it came to retesting that breakout.
On the daily, the RSI was beginning to diverge with the price. They are now moving hand in hand. The daily is massively overbought, but oil bears stand no chance until they retake $85.
In the meantime, US crude production in the week to January 28 dropped 100,000 b/d to 11.5 million b/d. As did stocks of crude and distillates, which were down a million barrels and 2.4 million barrels to 415.1 million barrels and 122.7 million barrels respectively. Gasoline stocks, however, increased 2.1 million barrels to 250 million barrels, and crude imports grew 849,000 b/d to 7.1 mb/d. Refinery utilization decreased a percentage point to 86.7 percent.
E-mini S&P 500: Currently net long 158.8k, down 68.1k.
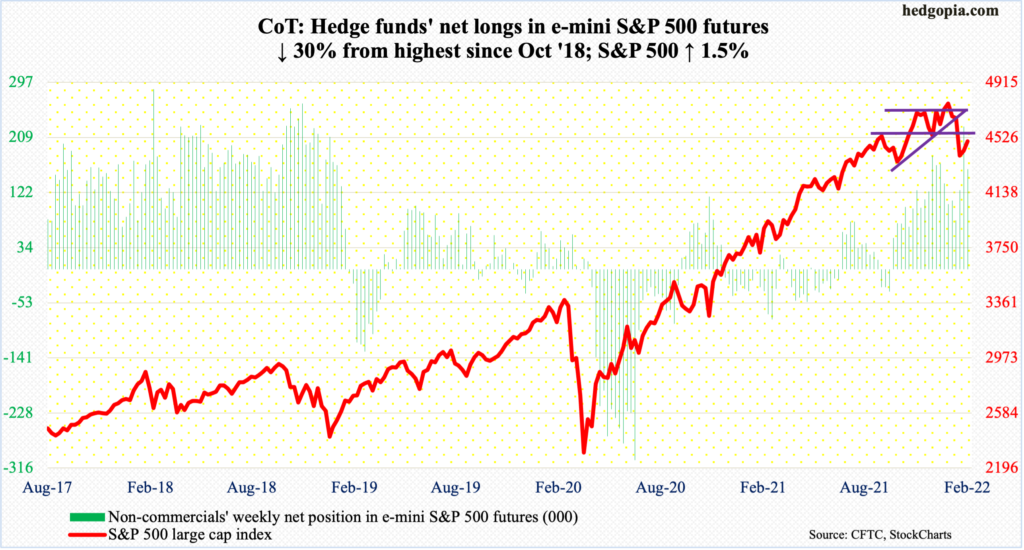
After last week’s weekly hammer, the S&P 500 rallied vigorously in the first three sessions, reaching as high as 4595 intraday Wednesday; the broken horizontal resistance at 4540s was recaptured in that session but a golden ratio proved tough.
The large cap index peaked on January 4 at 4819, subsequently bottoming on the 24th at 4223, for a 12.4 percent decline. A 61.8-percent Fibonacci retracement of this mini-collapse lies at 4591. The technically oriented ones pay close attention to this retracement. Come Thursday, the index was slammed 2.4 percent lower; the pretext was disappointing earnings from Facebook parent Meta (FB).
Last week’s upside reversal on the S&P 500 was still not able to attract inflows. In the week to Wednesday, US-based equity funds lost $5.2 billion, for three-week withdrawals of $11.7 billion (courtesy of Lipper). SPY (SPDR S&P 500 ETF), VOO (Vanguard S&P 500 ETF) and IVV (iShares Core S&P 500 ETF) in the week to Wednesday lost $4.8 billion; this was the fourth consecutive negative week for a combined loss of $15.8 billion (courtesy of ETF.com).
For now, 4540s is where a bull-bear duel intensifies; incidentally, this was where Thursday’s as well as Friday’s highs lay before drawing sellers. The 200-day lies underneath at 4444; a loss of the average raises odds of downward pressure toward the lows of late last month. Bulls’ consolation is that the average was defended on Friday.
Longer-term, the January barometer is predicting a down year this year (more on this here).
Euro: Currently net long 29.7k, down 1.8k.
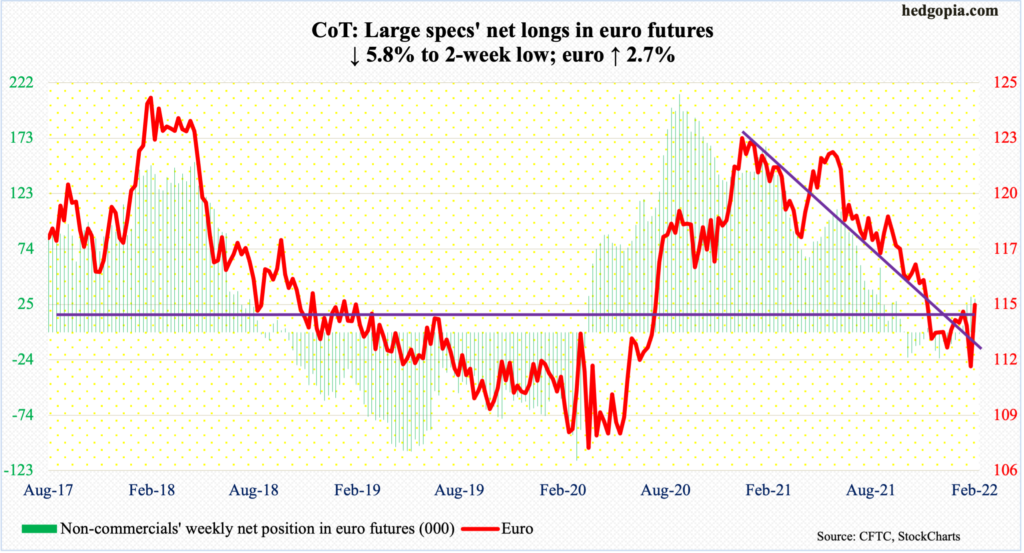
The European Central Bank this week kept key interest rates unchanged despite record inflation. Arguably, surging energy prices and supply-side constraints can be blamed for the price rise, not excessive demand. At the same time, the central bank’s desire to continue emergency stimulus plans amidst decent growth in the economy and surging prices is raising eyebrows. This week, the Bank of England raised raises – its first back-to-back hike since 2004.
Markets are beginning to bet the ECB’s hands will be forced sooner than later. After last Friday’s false breakdown, this week started weak with Monday’s low of $1.1125 undercutting last week’s low but only to reverse higher. By Friday, the euro ($1.1449) tagged $1.1470. The 50-day, which is now curling up, has been retaken.
Resistance at $1.14-$1.15, which goes back at least 18 years and drew sellers mid-January, is where bulls’ mettle will be tested.
Gold: Currently net long 172.1k, down 48k.
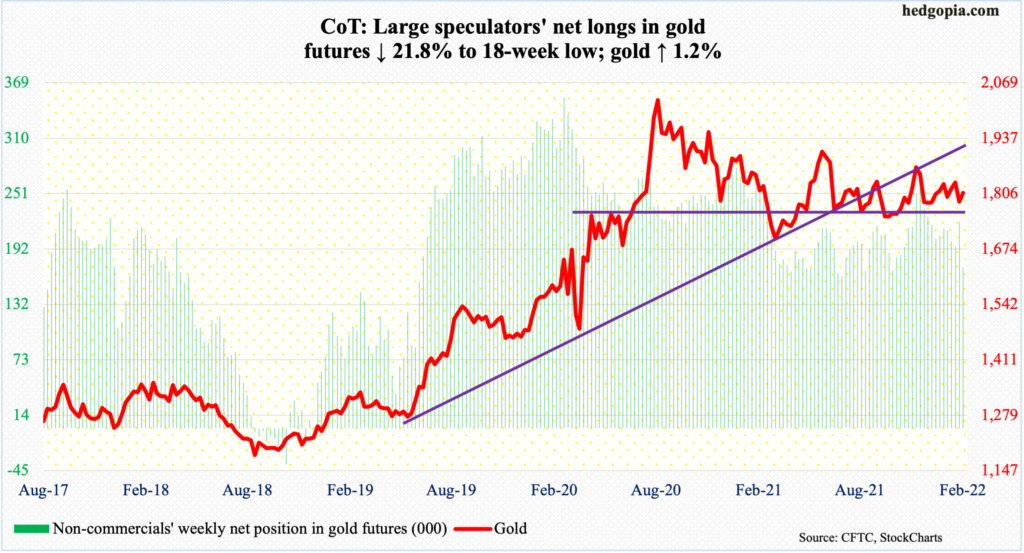
For the first time in a while, GLD (SPDR Gold Shares) is witnessing inflows, with $133 million having flowed in the week to Wednesday and $1.9 billion and $305 million respectively before that (courtesy of ETF.com).
For the week, gold ($1,808/ounce) rallied 1.2 percent, but remains in no-man’s land. The last time support at $1,760s-$1,770s was tested was mid-December. At the same time, the metal has been unable to sustainably break out of $1,830s. As long as $1,760s-$1,770s remains intact, gold bugs deserve the benefit of the doubt.
Nasdaq 100 index (mini): Currently net short 989, up 31.1k.
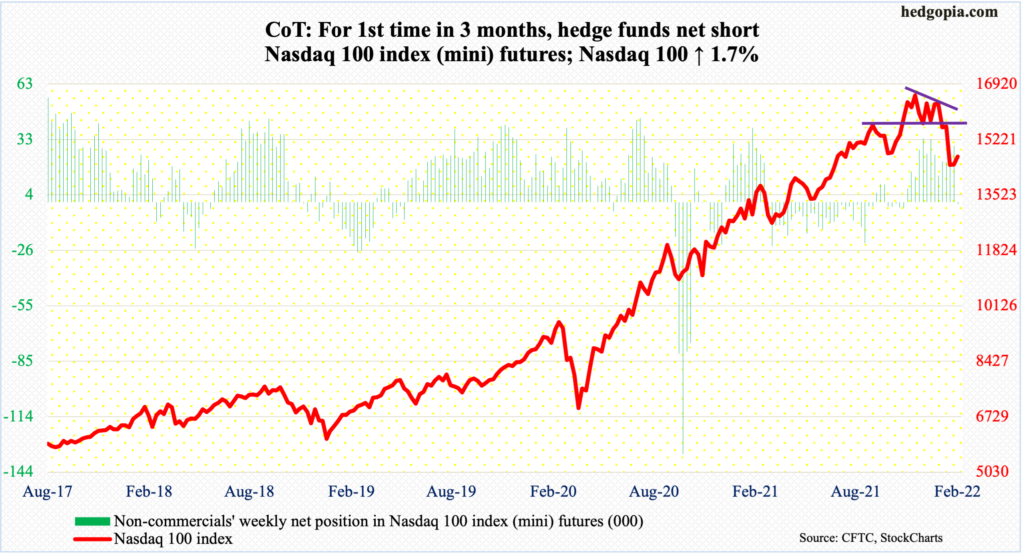
Google owner Alphabet’s (GOOG) and Amazon’s (AMZN) 4Q21 earnings reports were cherished, while FB’s was pooh-poohed. Amidst this push and pull, the Nasdaq 100 (14694) ended the week up 1.7 percent but was up as much as 5.1 percent at Wednesday’s high of 15196; the 200-day was recaptured in that session but was lost in the very next session as the tech-heavy index collapsed 4.2 percent on FB’s results.
In the end, the week ended with a shooting star. Bulls can draw solace in the fact that shorter-term averages are showing signs of stability.
Russell 2000 mini-index: Currently net short 36.1k, up 33.3k.
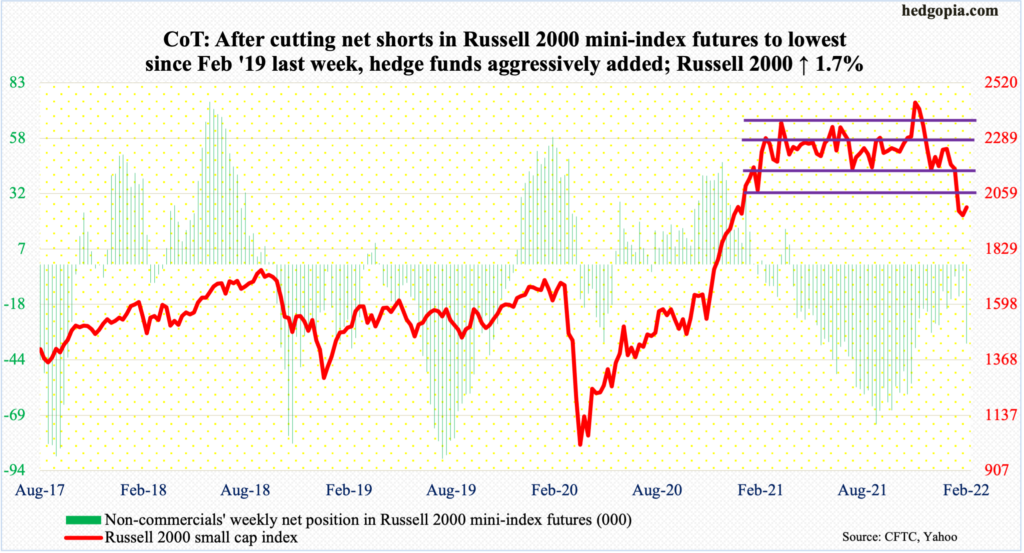
Since last March, the Russell 2000 (2002) had been rangebound between 2350s and 2080s, and between 2280s and 2150s within this box. On Nov 3, it broke out but was quickly followed by a failed retest on the 19th. Two weeks ago, it broke down, dropping out.
At Wednesday’s high this week, the small cap index was up as much as 4.4 percent, with the session tagging 2055; a session earlier, it hit 2053. The underside of the broken box support was not even tested and sellers showed up in droves.
So, this is how it looks for now – potential offers at/below 2080s and bids at/around 1900.
US Dollar Index: Currently net long 34.6k, down 2.3k.
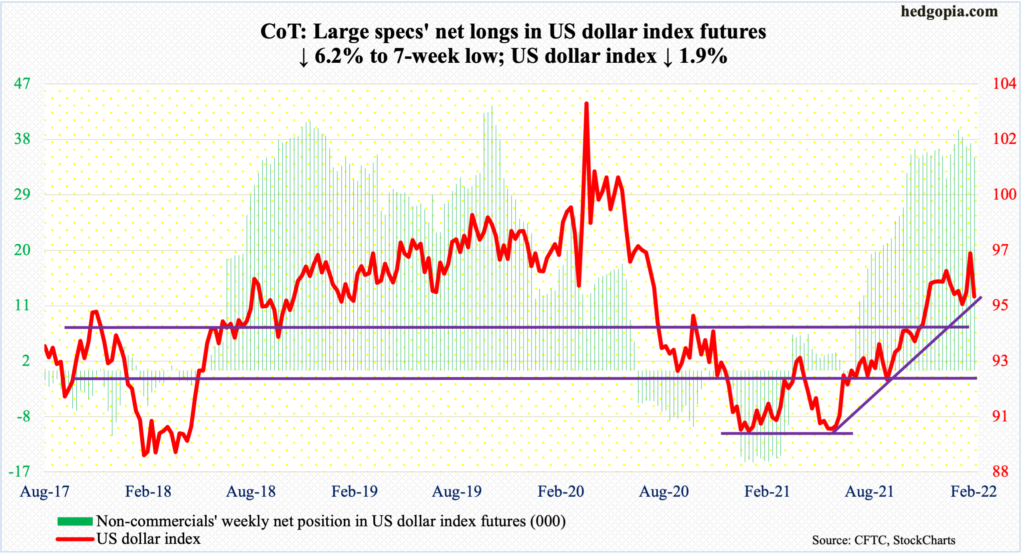
The breakout late last week at 97 did not last long. The US dollar index (95.48) dropped in the first four sessions this week to also lose the 50-day (96.07) as well as a rising trend line from last May.
On Friday, horizontal support at 94.50s was tested. It is a must-hold.
VIX: Currently net short 26.7k, down 15k.
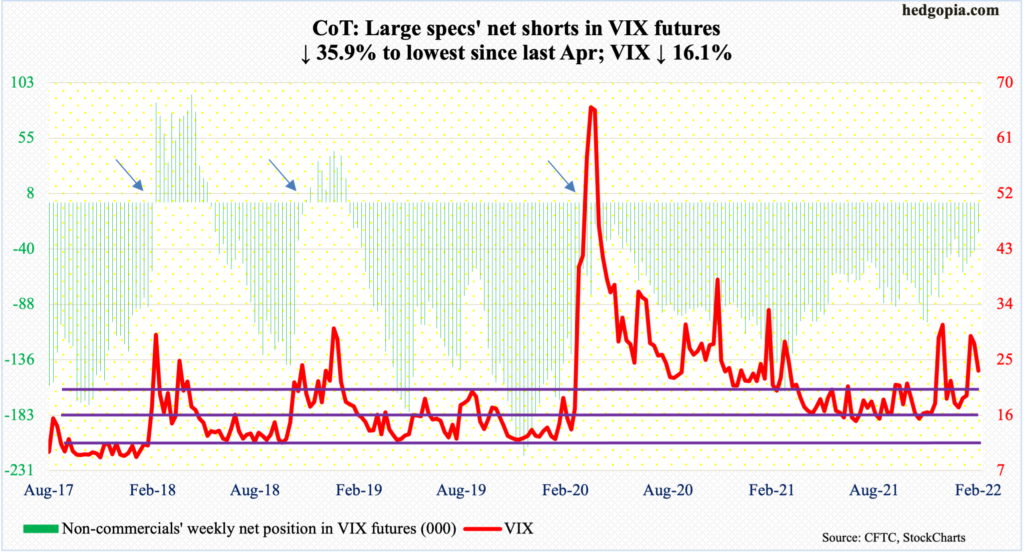
After last week’s massive spike reversal (more on this here), VIX continued lower in the first two sessions this week. Downward momentum continued early Wednesday but only for the volatility index to bottom at 20.46 intraday to close the session at 22.09; this was a successful defense of both the low-20s and a rising trend line from January 4 when the S&P 500 peaked.
Through Wednesday’s low, VIX (23.22) quickly unraveled from the intraday high of 38.94 on January 24.
For now, low-20s on the downside and mid-20s on the upside are the levels to watch. Whichever goes first, momentum likely follows in that direction.


