
From CME:
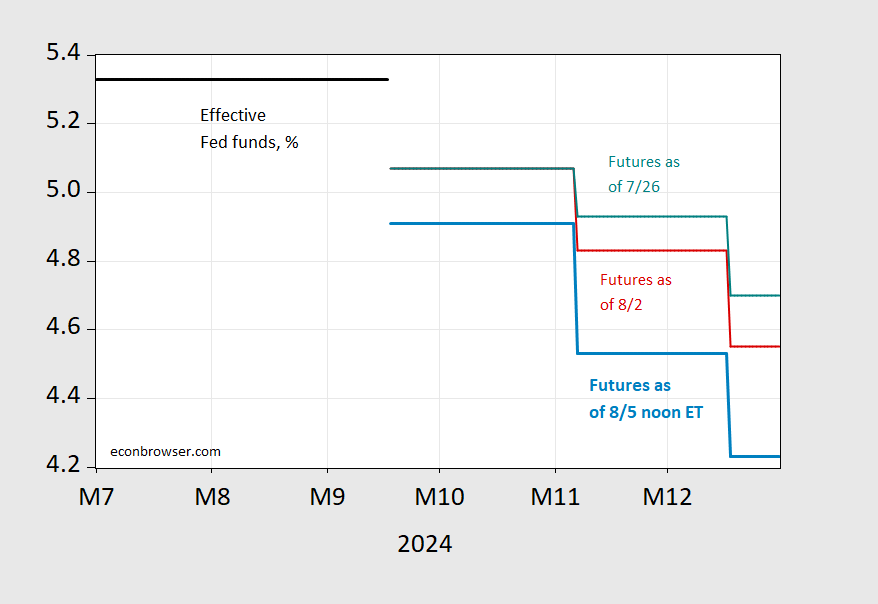
Figure 1: Effective Fed funds (bold black), from futures as of 7/26 (teal), as of 8/2 (red), and of 8/5 noon ET (light blue), in %. Source: Fed, CME, author’s calculations.
Note the ten-year Treasury yield also fell at open:
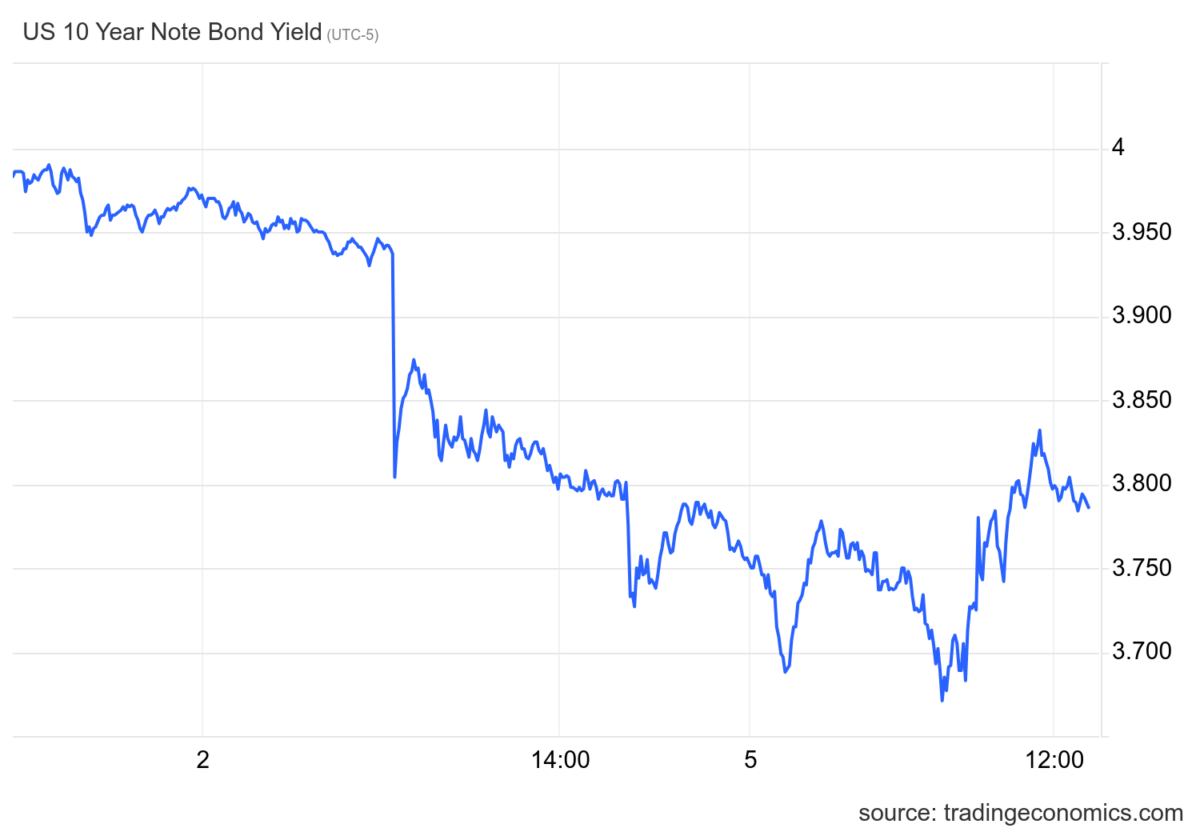
Note: Central Time.
Addendum:
Fed funds path relative to CBO June projection:
(Click on image to enlarge)
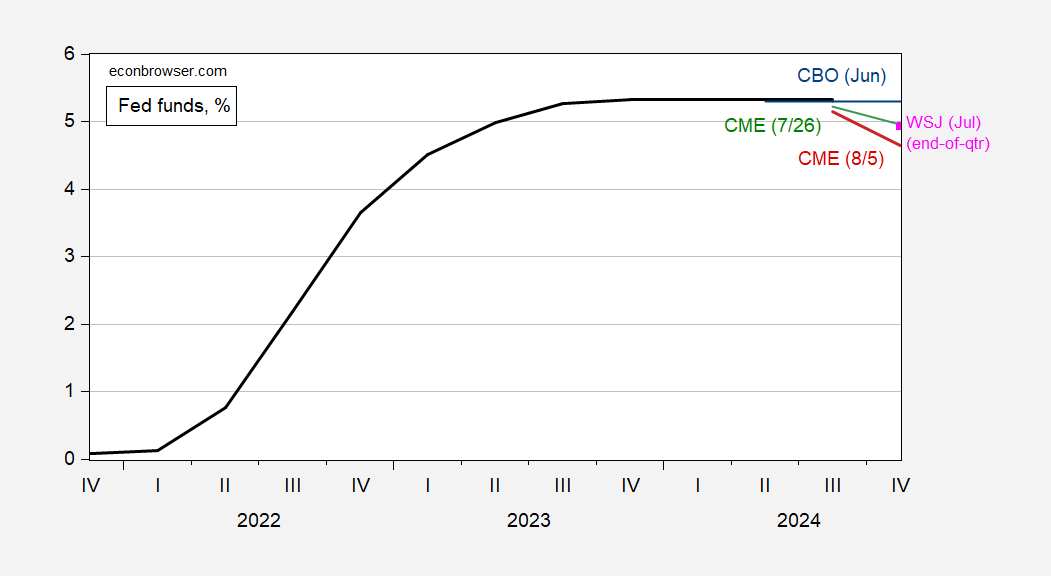
Figure 2: Fed funds (black), CBO projection (blue), WSJ July survey mean end-of-quarter (pink square), CME futures implied as of 7/26 (green), as of 8/5 noon ET (red), all in %. Source: Fed, CME, WSJ survey, and author’s calculations.
More By This Author:
Who Better Predicted The Transitory Inflation Surge Of 2021-24?An Eventful Week – Interest Rates
Business Cycle Indicators, With Employment, Monthly GDP


Comments
Log in or sign up to join the conversation.