
It seems that recession is imminent, according to some accounts (60% in 10/14 Bloomberg panel,63% in the WSJ October survey, 100% in the Wong/Winger model). WaPo “As recession fears rise, Washington begins to weigh how to respond”. What do some models say about recession and growth?
For recession:
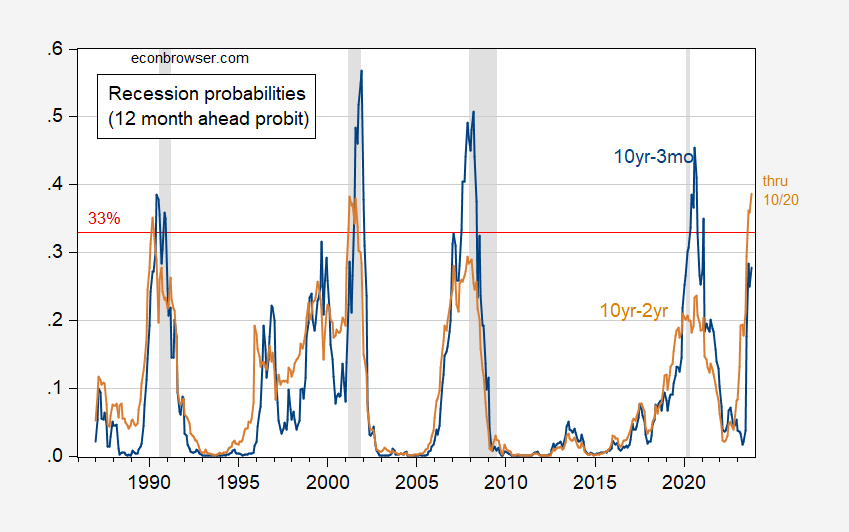
Figure 1: Probability of recession from 10yr-3mo Treasury spread (blue), from 10yr-2yr spread (tan), based on probit model 12-month-ahead. 33% threshold in red. NBER defined peak-to-trough recession dates shaded gray. Source: Author’s calculations, NBER.
The 33% threshold implies no missed positives for the 10yr-3mo spread, but the 10yr-2yr would’ve missed the two most recent recessions. Only the 10yr-2yr spread implies a recession 12 months hence.
These probabilities are based upon term spreads (October spread for data up to 10/20):
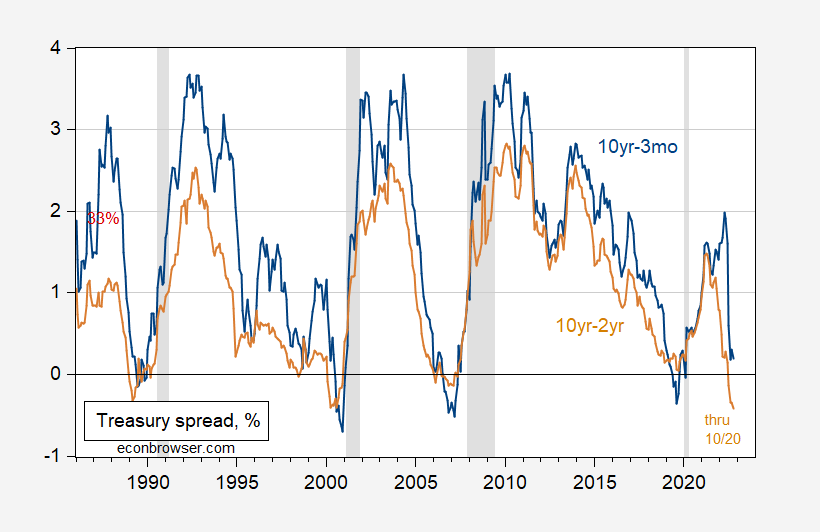
Figure 2: 10yr-3mo Treasury spread (blue), 10yr-2yr spread (tan), both in %. October observation pertains to data through 10/20. NBER defined peak-to-trough recession dates shaded gray. Source: US Treasury, NBER.
The probit models, estimated over the “Great Moderation” period, yield McFadden R2 of 27 and 18% for 10yr-3mo and 10yr-2yr spreads, respectively.
Aside from recession, one can also look to see how economic growth is predicted. Now, negative industrial production growth is not necessarily the same as recession (see discussion of how recession differs from negative output movement here), but they are related.
Chinn-Kucko (2015) estimate that each one percentage point increase in the 10yr-3mo spread is associated with a 1.13% acceleration in industrial production growth, over the 1998-2013 period.
In a recent paper, Arthur Stalla-Bourdillon, Nicolas Chatelais, and I estimate the relationship between the term spread, dividend yield, and lagged growth rate for the 12-month ahead growth rate, as compared to a sectorally disaggregated divdend yield factor, and find that our preferred disaggregated factor outperforms the competitors, in terms of out-of-sample RMSFE comparisons. (Although the outperformance vis a vis the term spread is not statistically significant).
Here’s a picture of the current 10yr-3mo term spread and 12-month IP growth, lead one year:
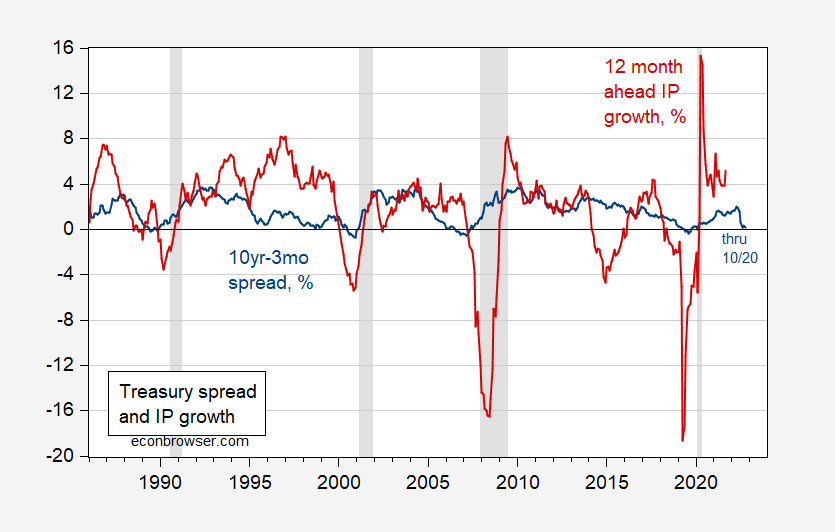
Figure 3: 10yr-3mo Treasury term spread, % (blue), and 12-month IP growth rate, lead by one year, % (red). October observation is for data through 10/20. NBER defined peak-to-trough recession dates shaded gray. Source: Treasury, Federal Reserve via FRED, NBER.
Using the models described in Chatelais, Stalla-Bourdillon, and Chinn (2022), we obtain the following estimates for IP growth up to September 2023.
(Click on image to enlarge)
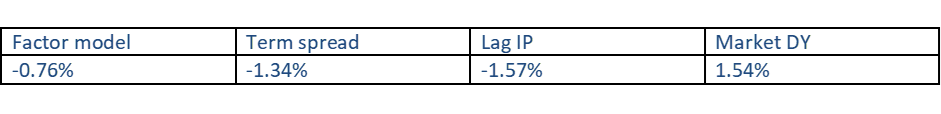
Source: Calculations based on model of Chatelais, Stalla-Bourdillon, Chinn (2022).
Our factor model predicts (as does the term spread and lagged IP model) a modest decline in industrial production over the course of the next year. Our model does particularly well vis a vis the competitors during periods of negative output growth. The positive view from the aggregate dividend yield is somewhat surprising, but then, our model should outperform when investor discount rates (composed of the risk free rate and the equity risk premium) move around a lot, which has arguably been the case.
So, recession probabilities are on the rise (other models will imply higher likelihoods), but our model predicts a modest decline in output (as measured by industrial production).
More By This Author:
Weekly Macroeconomic Activity Through October, 15China Q3 GDP Is A Mystery
Forecasts Of Russian GDP, Pre- And Post-


Comments
Log in or sign up to join the conversation.