
As measured by NY Fed WEI, OECD Weekly Tracker, and Baumeister, Leiva-Leon and Sims WECI.
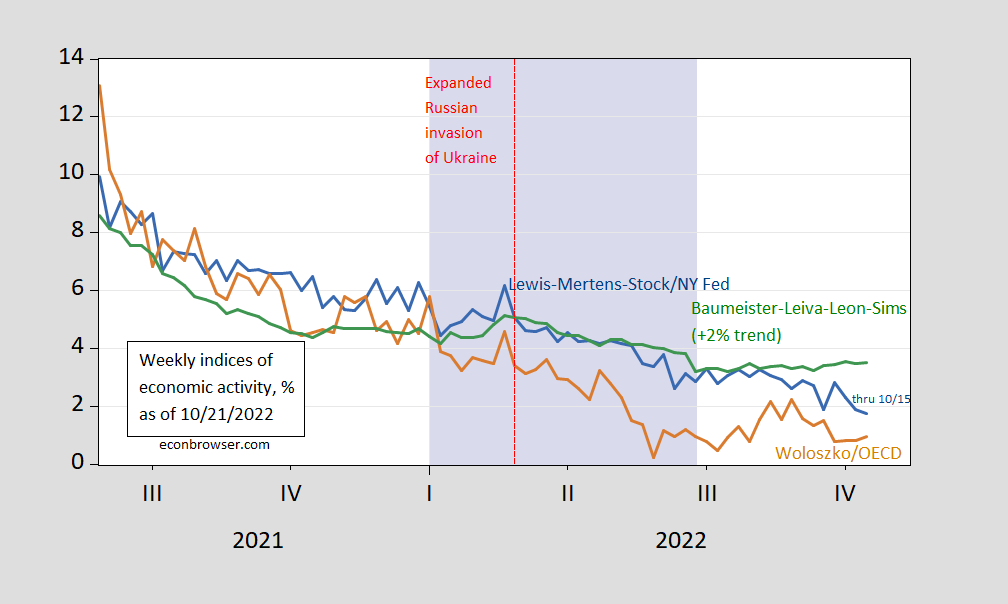
Figure 1: Lewis-Mertens-Stock (NY Fed) Weekly Economic Index (blue), Woloszko (OECD) Weekly Tracker (tan), Baumeister-Leiva-Leon-Sims Weekly Economic Conditions Index for US plus 2% trend (green). Lilac shading denotes a hypothetical 2022H1 recession. Source: NY Fed via FRED, OECD, WECI, and author’s calculations.
The WEI has been falling for three weeks now, to 1.2% from 2.8% for the week ending 9/24, while the Weekly Tracker and WECI both rose. The Weekly Tracker continues to indicate lower growth than the WEI, unsurprisingly, given the large differences in methodologies. The WEI relies on correlations in ten series available at the weekly frequency (e.g., unemployment claims, fuel sales, retail sales). The Weekly Tracker — at 1.0% — is a “big data” approach that uses Google Trends and machine learning to track GDP.
The WEI reading for the week ending 10/15 of 1.2% is interpretable as a y/y quarter growth of 1.2% if the 1.2% reading were to persist for an entire quarter. The OECD Weekly Tracker reading of 1.0% is interpretable as a y/y growth rate of 1.0% for year ending 10/15. The Baumeister et al. reading of 1.5% is interpreted as a 1.5% growth rate in excess of long term trend growth rate. Average growth of US GDP over the 2000-19 period is about 2%, so this implies a 3.5% growth rate for the year ending 10/15.
Since these are year-on-year growth rates, it’s possible we were in a recession in H1 as one observer asserted a couple months ago, but it (still) seems unlikely.
GDPNow for Q3 as of 10/19 is 2.9% q/q SAAR.
More By This Author:
China Q3 GDP Is A MysteryForecasts Of Russian GDP, Pre- And Post-
Business Cycle Indicators As Of Mid-October 2022


Comments
Log in or sign up to join the conversation.