
US stocks in general sold off last week, but the lows of Wednesday and Thursday were bought, with Friday’s rally the icing on the cake. This took place amidst June’s red-hot CPI report and disappointing earnings from JPM. As 2Q earnings season just got underway, investors are looking for a reason to own equities.
Last week, the S&P 500 went down 0.9 percent, but it also witnessed a reversal. At Thursday’s low, it was down as much as 4.6 percent for the week, but only to then reverse higher, including Friday’s 1.9-percent jump with a gap-up marubozu. In the end, the large cap index ended with a weekly bullish hammer.
This bodes well for the sessions ahead.
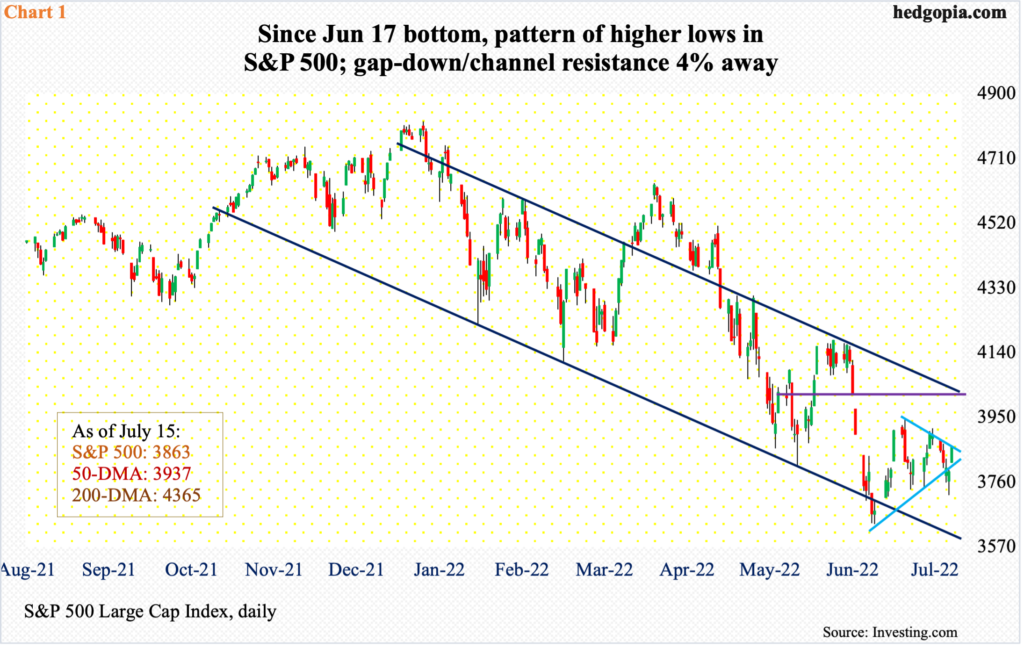
After peaking this January at 4819 through last month’s trough at 3637, the S&P 500 declined 24.5 percent. Closing last week at 3863, it is still down 19.8 percent from that high. Things are oversold.
The most recent high of 3946 was made on June 28. A falling trend line from that high will be broken right around here. After that lies the 50-day moving average at 3937, followed by gap-down resistance at 4017 (Chart 1).
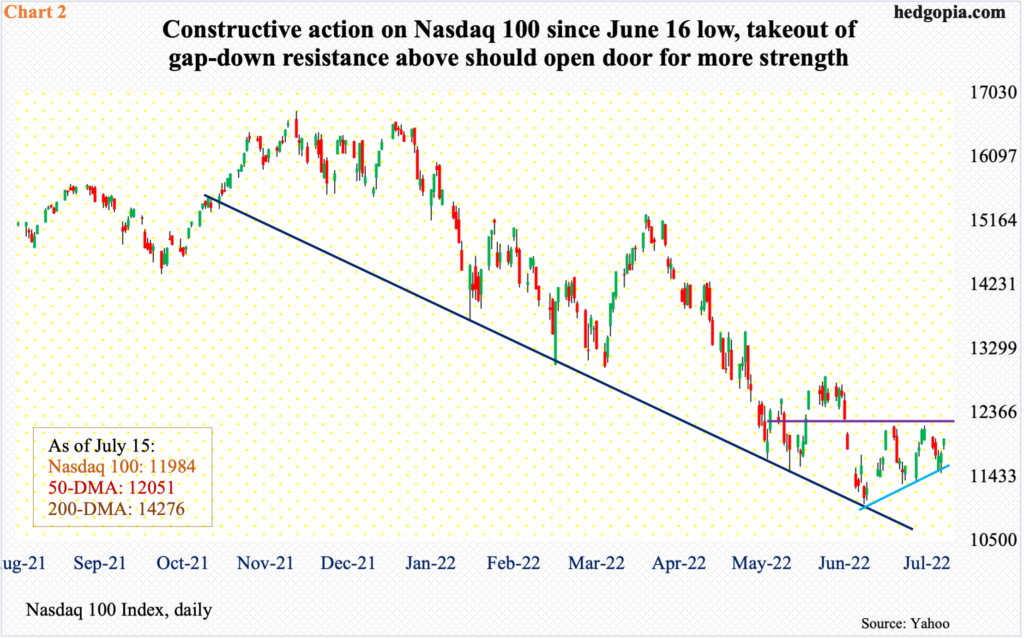
A similar gap-down resistance on the Nasdaq 100 (11984) lies at 12260s. Before the index gets there, it will have to reclaim the 50-day at 12051.
As was the case with the S&P 500, the tech-heavy index saw buying of weakness last Wednesday and Thursday. Plus, a rising trend line from June 16 when it bottomed at 11037 was defended (Chart 2). Through that low, the Nasdaq 100 plunged 34.2 percent from last November’s record high 16765.
Leading tech outfits will begin to report their June quarter next week. Ahead of this, there were signs later last week that investors were beginning to position themselves with a long bias.
Small-caps are similarly giving out positive vibes.
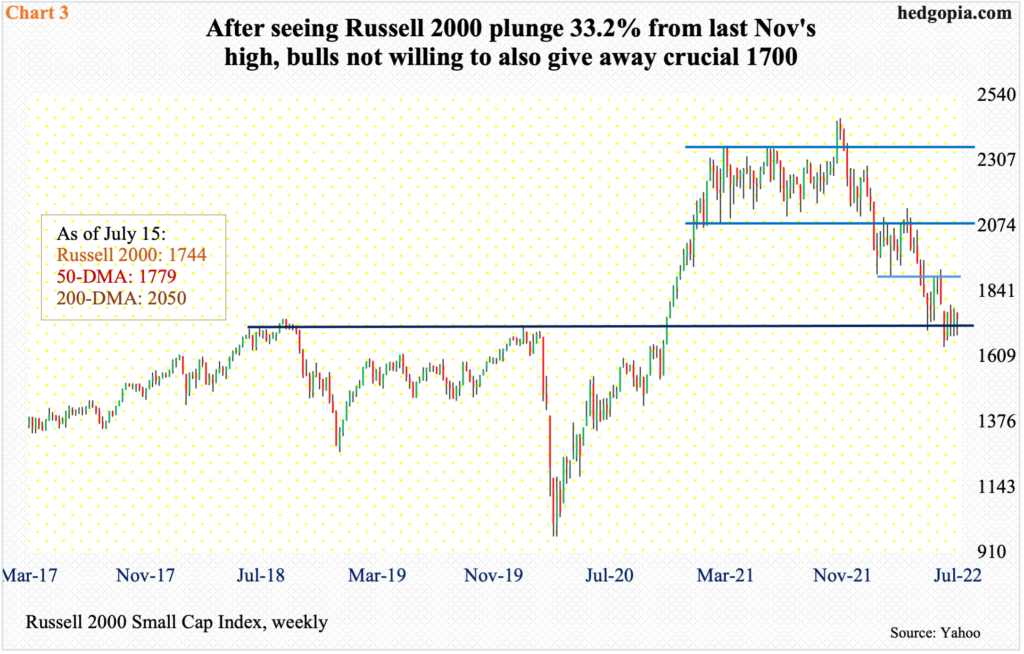
From last November’s record high 2459 through the low of 1641 on June 16, the Russell 2000 tumbled 33.2 percent. At that low, small-cap bulls were at risk of also losing 1700, which is where the index broke out of in November 2020 (Chart 3). They have managed to put their foot down.
Last week, 1700 was tested – successfully; on Thursday, the Russell 2000 tagged 1685 intraday before closing the session at 1708. From the June 16 low, the index has closed sub-1700 in only four sessions, while it has closed above that threshold for 16 straight sessions.
Continued defense of 1700 should eventually open the door toward 1900. Earlier, a major breakdown occurred mid-January, breaching 2080s; for 10 months leading up to that, the small cap index (1744) seesawed between 2080s and 2350s. It then played ping pong between 2080s and 1900, followed by a rangebound action between 1900 and 1700 (Chart 3).
Last week’s constructive action as the week was winding down came in the face of red-hot inflation and a couple of disappointing earnings reports from financials.
Post-2Q earnings, stocks of both JP Morgan (JPM) and Morgan Stanley (MS) took a hit on Thursday, but the session lows were bought with a big rally on Friday helping the stocks close out the week above Wednesday’s close.
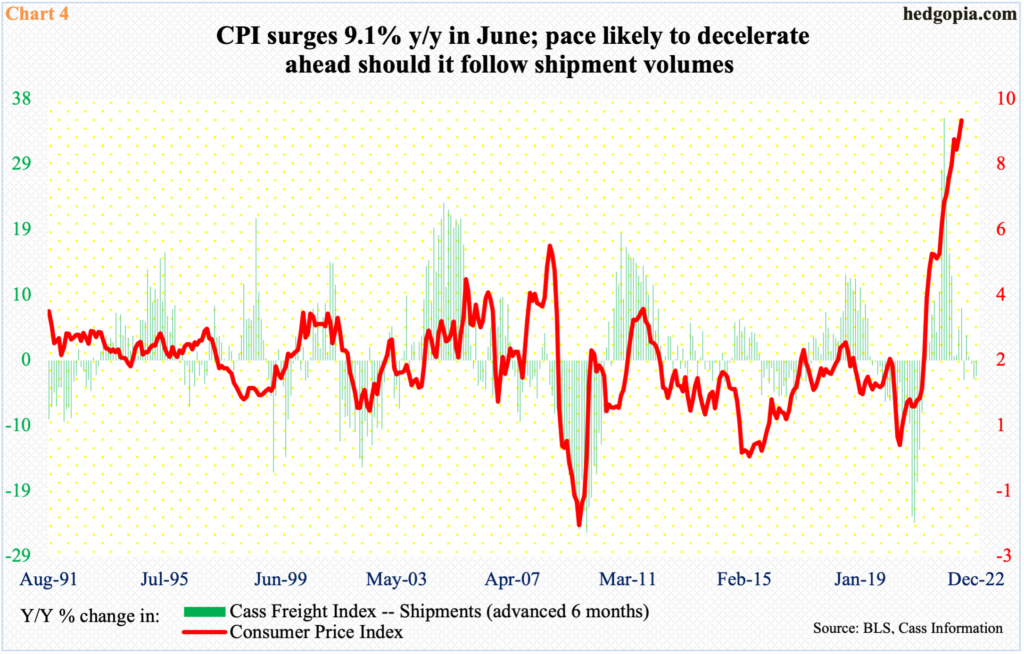
Wednesday’s initial selling in equities was triggered by June’s consumer price index which rose 9.1 percent year-over-year to the highest since November 1981. Futures traders immediately priced in a 100-basis-point increase in the FOMC meeting next week. They went back to expecting a 75 after Christopher Waller, governor, jawboned the next day saying he supports a 75-basis-point move and that the markets may have gotten ahead of themselves a little bit on Wednesday. Plus, cooler heads probably prevailed considering how the Cass Freight Index – Shipments, among others, is pointing to imminent deceleration in inflation (Chart 4).
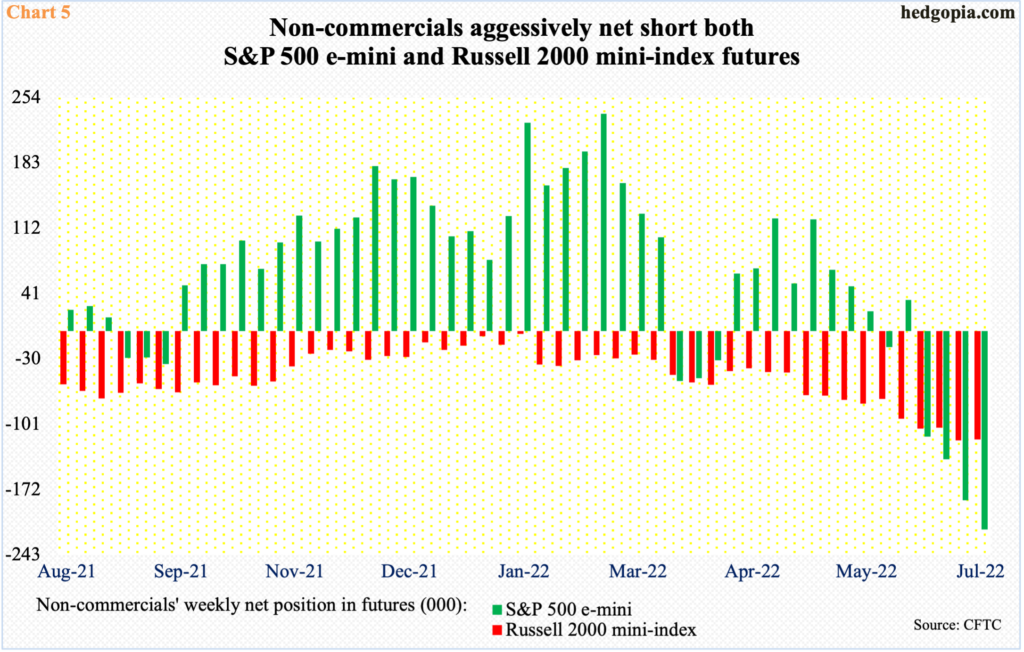
In the right circumstances for equity bulls, non-commercials – unwillingly – could end up helping.
In the futures market, these traders have built up sizable short holdings in both S&P 500 e-mini and Russell 2000 mini-index contracts (Chart 5). In the event of a rally ahead in the cash, which is looking probable, short-covering is the path of least resistance.
As of last Tuesday, non-commercials were sitting on 215,528 S&P 500 e-mini shorts – the highest since June 2020 and versus net longs of 34,278 contracts merely four weeks ago. Similarly, in Russell 2000 mini-index futures, they have amassed 117,778 net shorts, down slightly from the prior week’s 117,593, which was the highest since September 2008.
Non-commercials have gotten aggressive at a time when VIX is giving out signs it wants to go lower for now.
The volatility index has posted lower highs for a while now – in fact since January (this year) when it ticked 38.94. Last week did not change this trend; Wednesday’s intraday high of 29.06 was a fourth straight lower weekly high.
VIX struggled at the 50-day on both Wednesday and Thursday, closing the week at 24.23, just above the 200-day at 24.05. A likely breach of the average makes the index vulnerable to a test of low-20s in the sessions ahead.
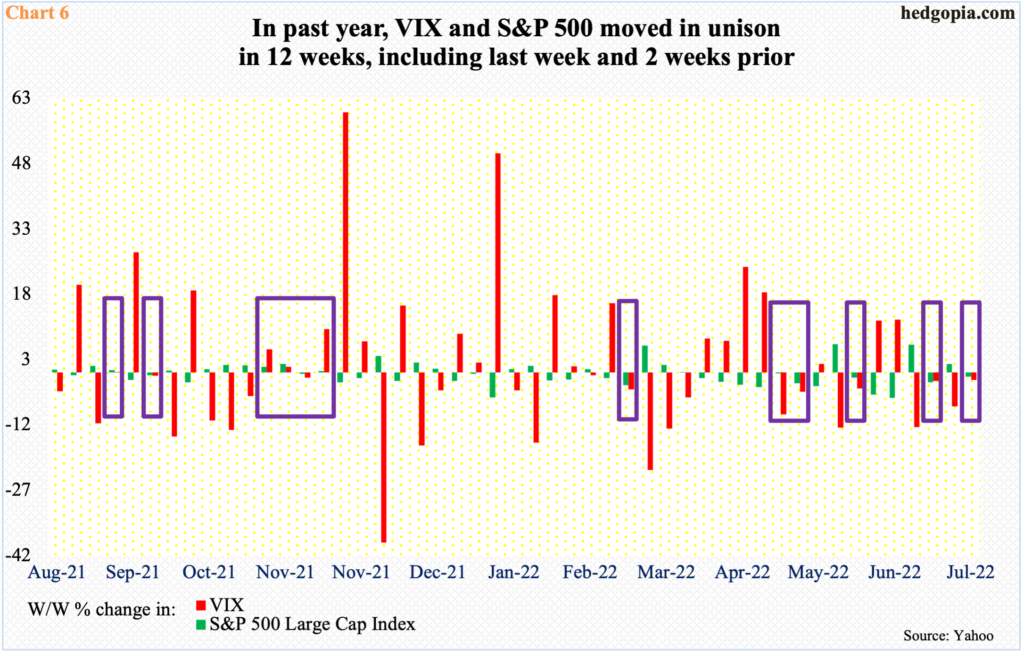
As perhaps a tell-tale, VIX was unable to rally last week even though the S&P 500 fell. This does not happen often (Chart 6). The two ordinarily move in opposite directions.
Thanks for reading!
More By This Author:
CoT Report - Futures, Hedge Fund Positions
Aggressive Rate-Hike Expectations Subject To Change Should Inflation Show Signs Of Stability
Peek Into The Future Thru Futures, Hedge Fund Positions - Latest CoT Report


Comments
Log in or sign up to join the conversation.