
The Fed is using both conventional and unconventional tools to deal with surging inflation. This is bound to impact economic activity, which is already showing signs of deceleration. Inflation could be the next shoe to drop. Any signs of this could force traders to hurriedly readjust their rate-hike expectations.
Last week’s FOMC minutes for the June 14-15 meeting showed members’ full commitment to a restrictive monetary policy. Markets are fully cooperating with this tightening posture.
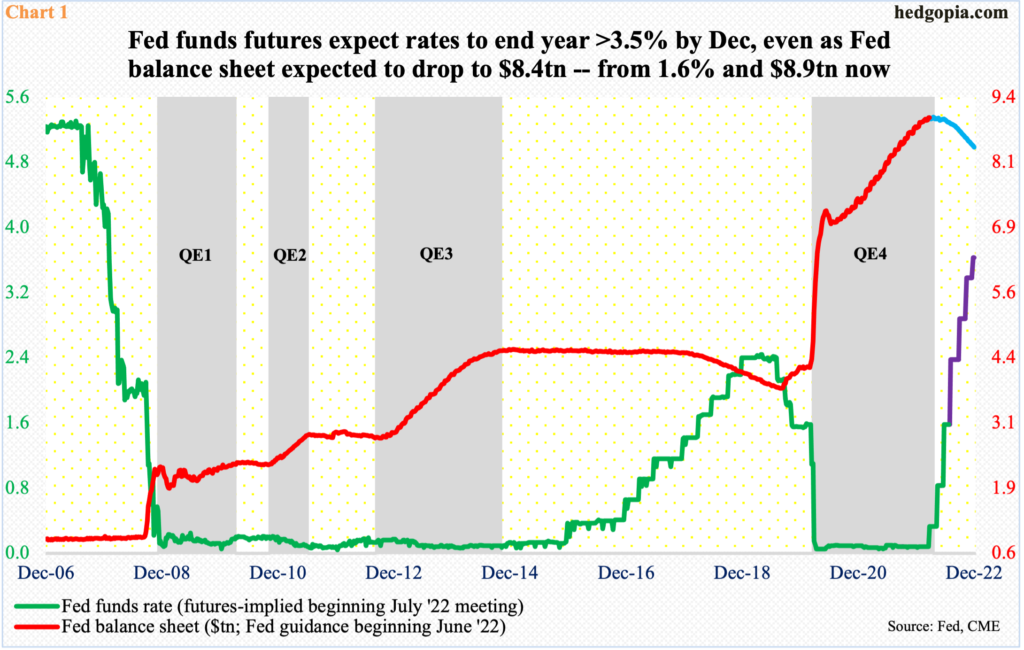
So far this year, the Federal Reserve has tightened three times – by 75 basis points in June, 50 basis points in May and 25 basis points in March – to a range of 150 basis points to 175 basis points. Futures traders expect the benchmark rates to range between 350 basis points and 375 basis points by the end of the year, pricing in a 75 later this month, a 50 each in September and November and a 25 in December.
Concurrently, the Fed is reducing its bloated balance sheet, which more than doubled from $4.24 trillion in March 2020 to $8.97 trillion in April this year. The central bank has guided to end the year around $8.4 trillion, which is still massive but at the same time is no longer rising (Chart 1).
All this tightening is bound to reverberate through the economy. This is taking place at a time when there already are signs of deceleration. The pace of job gains, for instance, has meaningfully downshifted.
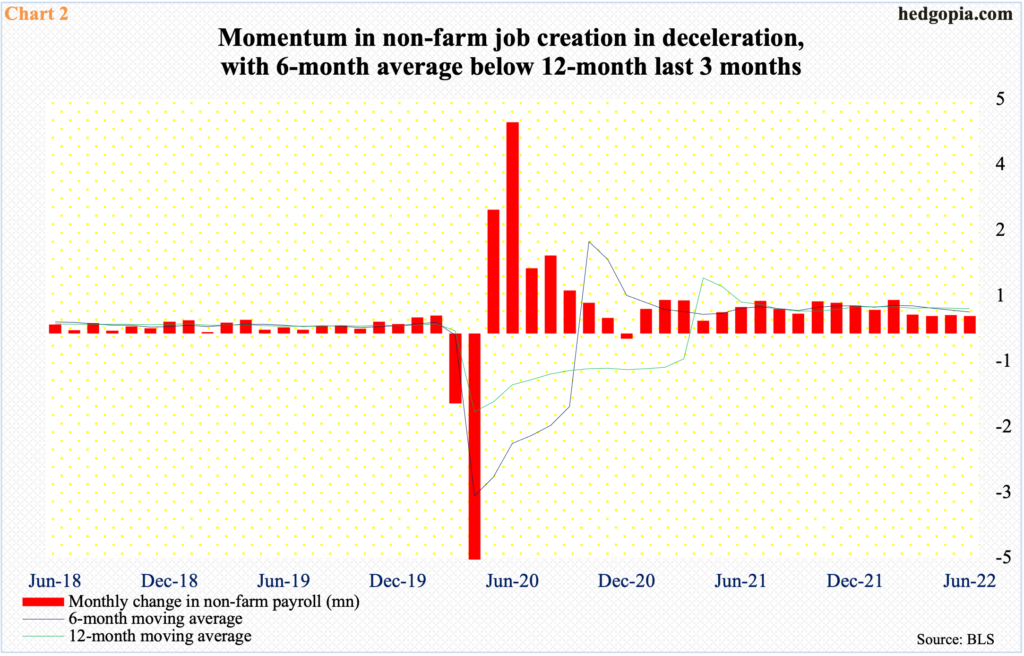
In June, the unemployment rate came in at 3.6 percent, which is not too far away from the pre-pandemic low of 3.5 percent from February 2020. Job gains, however, paint a different picture. In the first half this year, the economy created a monthly average of 457,000 non-farm jobs, substantially softer than last year’s monthly average of 562,000 jobs.
For four consecutive months through June, job gains failed to cross 400,000, with June at 372,000. The loss of momentum can also be measured by a six-month moving average which has now crossed under the 12-month (Chart 2).
The way things are shaping up, this gets worse before it gets better.
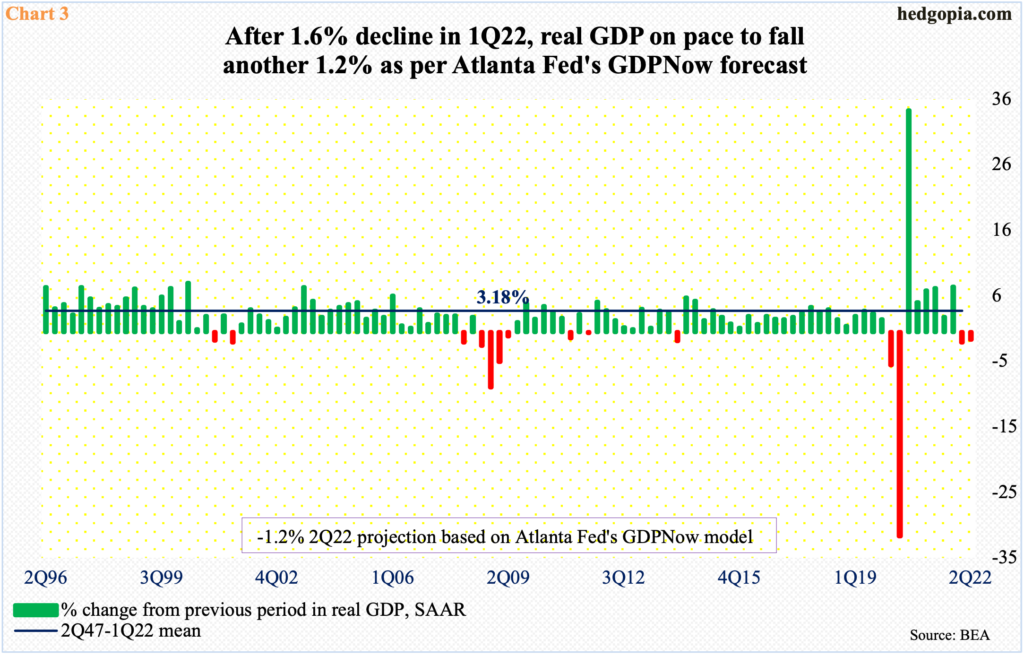
As a matter of fact, if the Atlanta Fed’s GDPNow model gets it right, real GDP declined 1.2 percent last quarter. This reflects last Friday’s employment report for June and wholesale trade for May; prior to that, the model was expecting a 2.1-percent contraction.
This, of course, comes on the heels of a 1.6-percent shrinkage in 1Q, which was the first decline in seven quarters (Chart 3).
Several commodities have already taken a hit expecting a slowdown.
Copper closed last week at $3.52/pound, down from March’s record high $5.04. Lumber similarly peaked at $1,733/1000 board feet in May last year, rolling over most recently from $1,338 in January to last week’s close of $726.
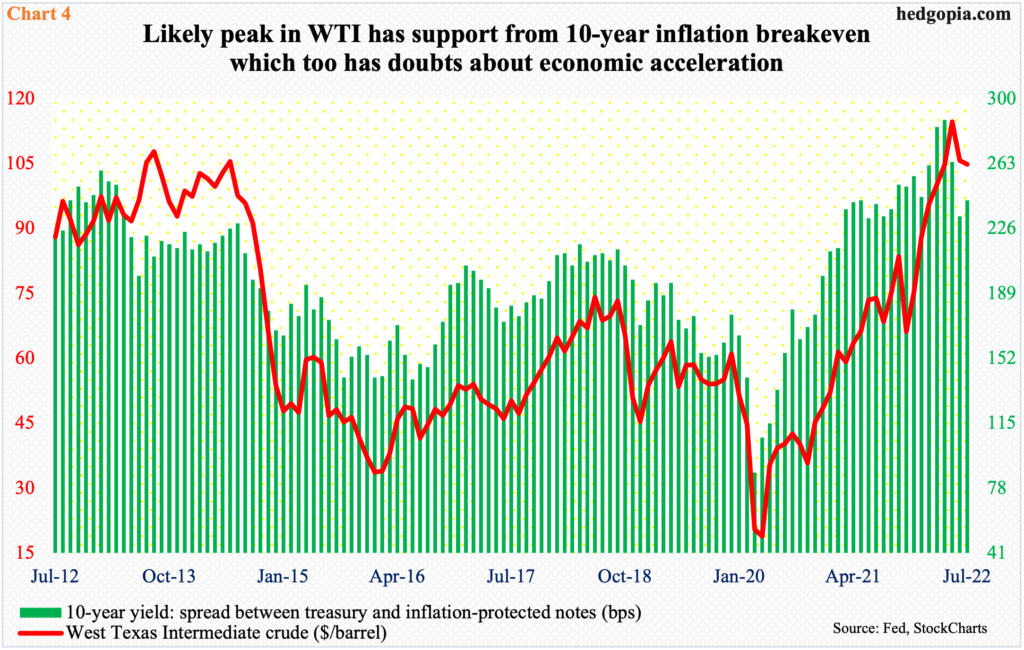
Crude oil is holding up, but even here weakness could be brewing. West Texas Intermediate crude rose as high as $130.50/barrel in March – versus its record high of $147.27 in July 2008 – before weakening.
Last Wednesday, the crude ticked $95.10 intraday, just about testing horizontal support at $93-$94, and it held, closing the week at $104.79. The daily for now is oversold. The 50-day rests at $110.18.
Longer-term, on the weekly as well as the monthly, there is room for downward pressure. Last December, WTI touched $62.43 before rallying.
Incidentally, WTI’s possible peak has support from the 10-year inflation breakeven rate, which, too, is beginning to anticipate impending slowdown (Chart 4).
It is probable these commodities have seen cycle highs. In this scenario, inflation could very well be in the process of peaking, if it has not already done so.
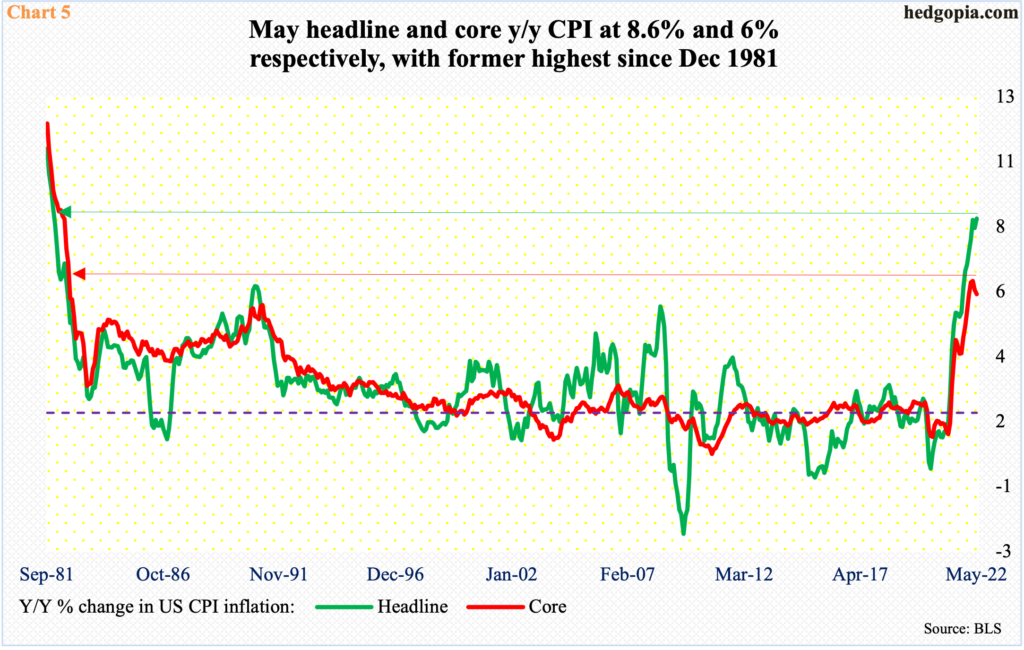
In May, headline and core PCE (personal consumption expenditures) respectively rose 6.4 percent and 4.7 percent year-over-year. The pace was slower than the 6.6 percent and 5.3 percent posted in March and February respectively.
Similarly, May headline and core CPI (consumer price index) jumped 8.6 percent and six percent y/y respectively, with the former highest since December 1981 and the latter softer than March’s 6.5 percent which was the highest since August 1982 (Chart 5).
June’s CPI numbers will be out this Wednesday and will be watched very closely. Any downside surprise can elicit positive reaction in the stock market.
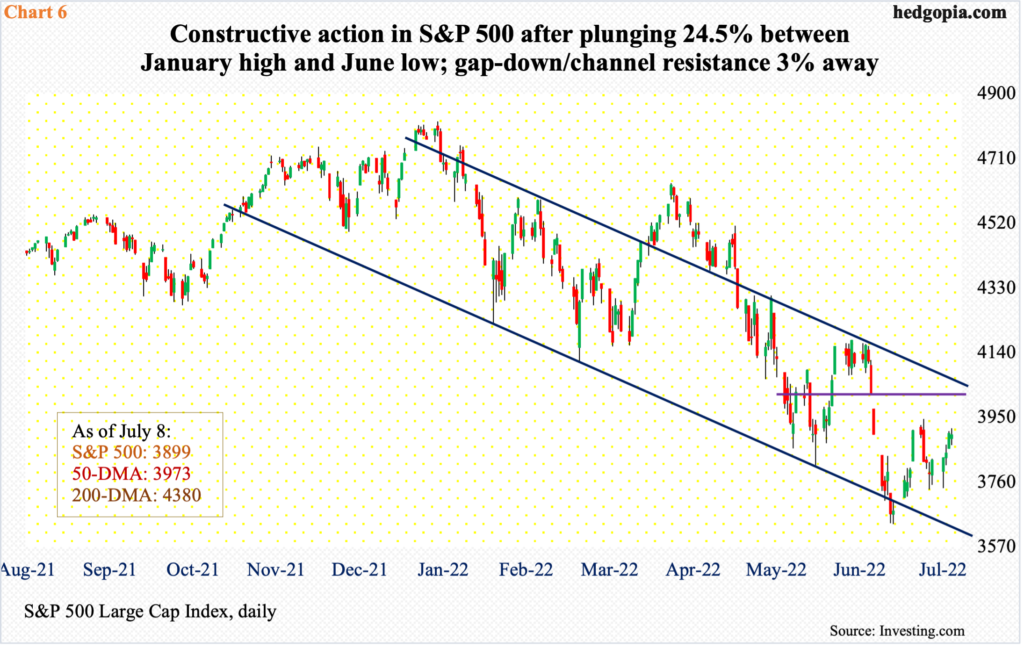
In the first half, equities got shellacked. From its January high to last month’s low, the S&P 500 tumbled 24.5 percent. In a scenario in which inflation begins to behave, there is room for the large cap index to unwind the weekly oversold condition it is in.
The June 16-17 lows of 3630s are important in this respect. The S&P 500 has since posted higher lows, with a potentially bullish 10/20 crossover last week. There is gap-down resistance just north of 4000, which coincides with channel resistance (Chart 6), and after that lies horizontal resistance at 4160s. The index closed out the week at 3899, up 1.9 percent – its second up week in the last three and the third in 14.
Thanks for reading!
More By This Author:
Peek Into The Future Thru Futures, Hedge Fund Positions - Latest CoT Report
Corporate Bond Issuance Continues To Soften, Can Potentially Impact Buybacks In Coming Quarters
Managements Have Opportunity To Use 2Q Earnings Season As Kitchen-Sink Quarter


Comments
Log in or sign up to join the conversation.