
NFP at +206K vs +191K.
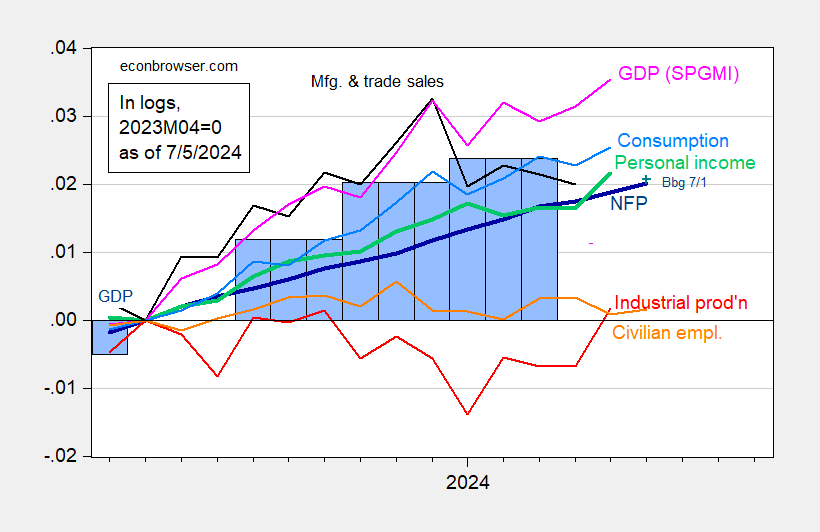
Figure 1: Nonfarm Payroll (NFP) employment from CES (bold blue), civilian employment (orange), industrial production (red), personal income excluding current transfers in Ch.2017$ (bold green), manufacturing and trade sales in Ch.2017$ (black), consumption in Ch.2017$ (light blue), and monthly GDP in Ch.2017$ (pink), GDP (blue bars), all log normalized to 2023M04=0. Source: BLS via FRED, Federal Reserve, BEA 2024Q1 third release, S&P Global Market Insights (nee Macroeconomic Advisers, IHS Markit) (7/1/2024 release), and author’s calculations.
There are questions about whether the CES is overstating employment growth, perhaps because of the birth-death model. Here is cumulative growth private NFP since March 2023 (last benchmarked data), compared against ADP’s series (which does not rely upon the birth-death model).
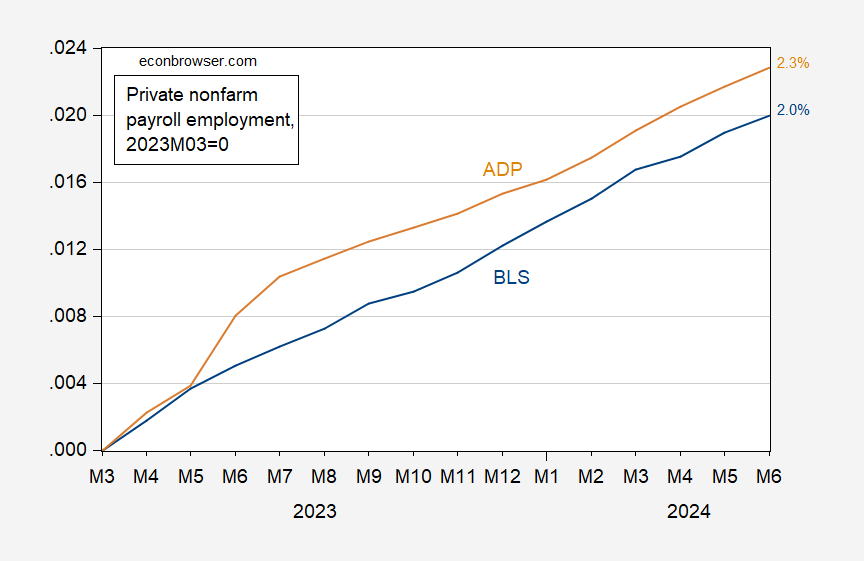
Figure 2: Private nonfarm payroll employment from BLS (blue), and from ADP (tan), in logs 2023M03=0. Source: BLS, ADP via FRED, and author’s calculations.
More By This Author:
Consensus – Real Time Sahm Rule For June
Monthly GDP Up Two Months In A Row
One Year Ahead Inflation Expectations Stable


Comments
Log in or sign up to join the conversation.