
Monthly GDP up two months in a row. Final sales in May up, but not offsetting completely decline in April. Here’s a picture of key indicators followed by the NBER BCDC, plus monthly GDP from SPGMI (formerly IHS-Markit, and Macroeconomic Advisers before that).
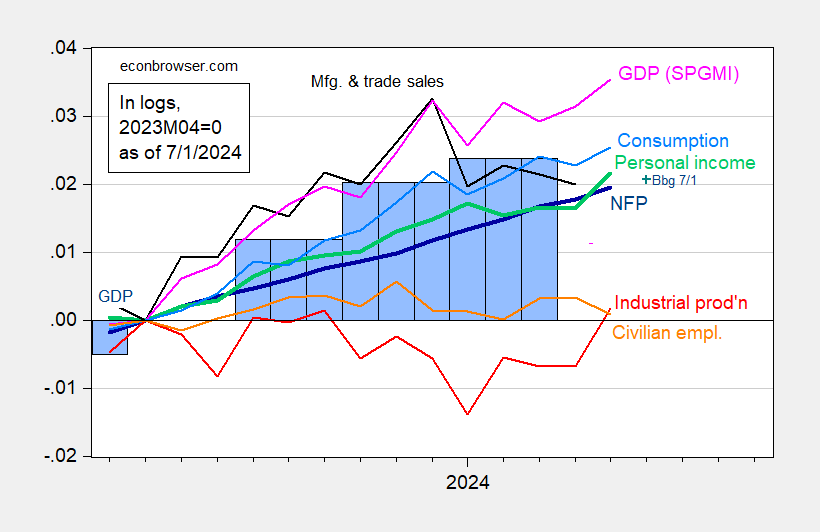
Figure 1: Nonfarm Payroll (NFP) employment from CES (bold blue), civilian employment (orange), industrial production (red), personal income excluding current transfers in Ch.2017$ (bold green), manufacturing and trade sales in Ch.2017$ (black), consumption in Ch.2017$ (light blue), and monthly GDP in Ch.2017$ (pink), GDP (blue bars), all log normalized to 2023M04=0. Source: BLS via FRED, Federal Reserve, BEA 2024Q1 third release, S&P Global Market Insights (nee Macroeconomic Advisers, IHS Markit) (7/1/2024 release), and author’s calculations.
Every indicator for which we have data, save civilian employment, is up in May.
On the other hand, GDPNow for Q1 is now 1.7% (SAAR), down from 2.2%. SPGMI tracking is 1.9%.
When combined with deceleration in core inflation measures, and year-ahead inflation expectations, it seems to me the Fed has thus far engineered a pretty soft landing (although one has to caveat that the economic activity indicators will be revised going forward).
More By This Author:
One Year Ahead Inflation Expectations StableSupreme Court Views On Price Stability And Full Employment
Instantaneous PCE Inflation In May


Comments
Log in or sign up to join the conversation.