
NFP employment increase of 263K surprises on upside (vs. Bloomberg consensus of 200K). This is the resulting picture for some key indicators followed by the NBER Business Cycle Dating Committee.
(Click on image to enlarge)
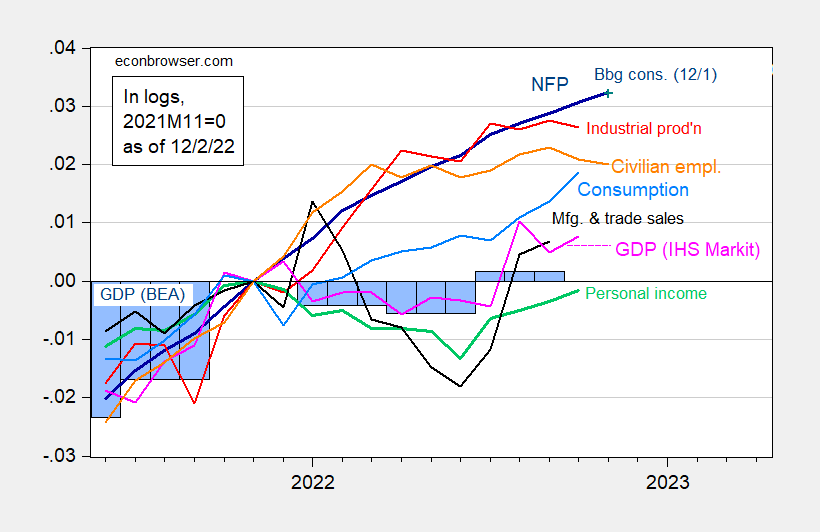
Figure 1: Nonfarm payroll employment, NFP (dark blue), Bloomberg consensus as of 12/1 (blue +), civilian employment (orange), industrial production (red), personal income excluding transfers in Ch.2012$ (green), manufacturing and trade sales in Ch.2012$ (black), consumption in Ch.2012$ (light blue), and monthly GDP in Ch.2012$ (pink), GDP (blue bars), all log normalized to 2021M11=0. Q3 Source: BLS, Federal Reserve, BEA, via FRED, IHS Markit (nee Macroeconomic Advisers) (12/1/2022 release), and author’s calculations.
Note that despite the upside surprise in employment, the picture of the economy’s overall trajectory barely changes (vis a vis the consensus change shown as the blue + in Figure 1).
Note that the employment release showed a continued divergence in trends between the establishment (CES) and household (CPS) surveys. That being said, the establishment series usually gets near full weighting in a measure tracking the economy — largely because of the greater relative stability of the CES measures (see Furman). I show below the NFP series, the NFP series accounting for the preliminary benchmark which raised the March 2022 employment, and the household employment series adjusted to the NFP concept.
(Click on image to enlarge)
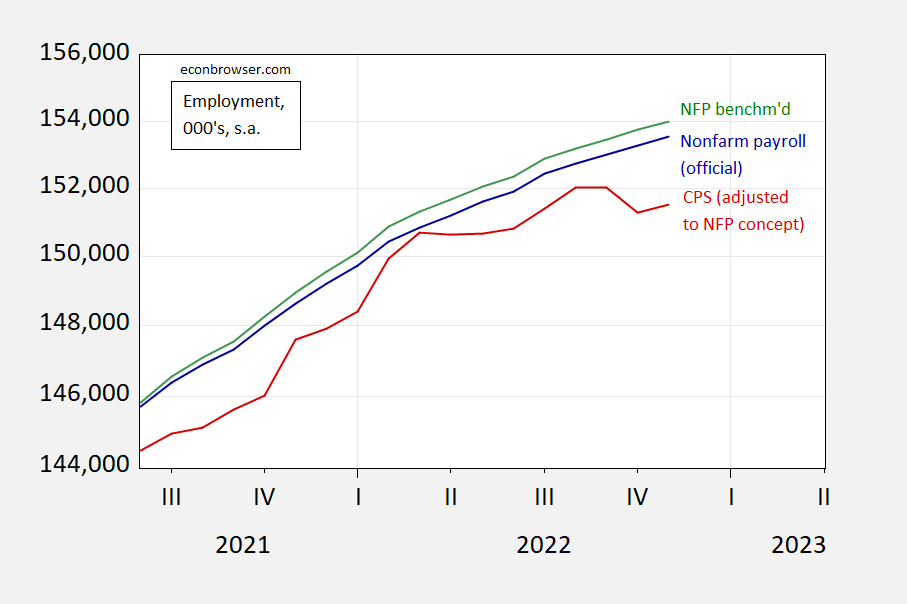
Figure 2: Nonfarm payroll employment (blue), NFP employment adjusted for preliminary benchmark revision for March 2022 (teal), and civilian employment adjusted to the NFP concept (red). Source: BLS, and author’s calculations.
The household employment series adjusted to the NFP concept shares the downward movement in the overall household civilian employment series, generally, but not in the last month’s data. This means there’s a (possibly local) peak at 2022M09 in the household series, which is taken by some observers to signal the onset of a recession — i.e., the household series signals a recession earlier than the establishment series.
(Click on image to enlarge)
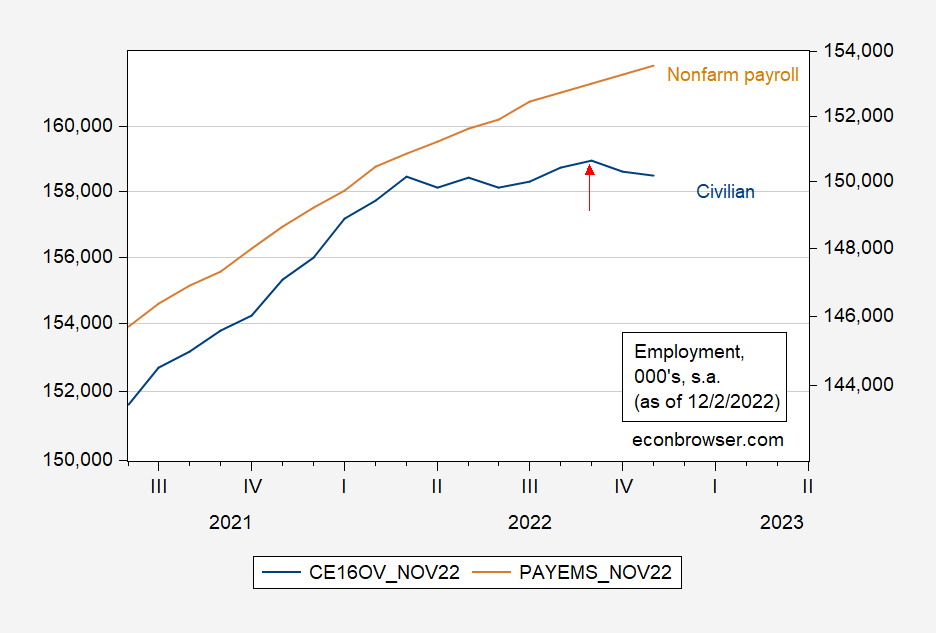
Figure 3: Civilian employment over age 16 (blue, left log scale), nonfarm payroll employment (tan, right log scale), both in 1000’s, seasonally adjusted, both as of 12/2/2022. Source: BLS via ALFRED, NBER.
As I previously noted, the strength of the proposition that the household series has this enhanced predictive power is quite weak (at least assessed using the last four recessions in the United States).
As an aside, further note that looking at a 2022M09 peak in civiian employment suggests no recession in 2022H1.
More By This Author:
Month-On-Month Inflation Seems To Have Peaked
Business Cycle Indicators At The Beginning Of December 2022
2022Q3 2nd Release, Alternative Measures Of Activity, And A Recession Of 2022H1?


Comments
Log in or sign up to join the conversation.