
That’s the message from PCE deflators.
(Click on image to enlarge)
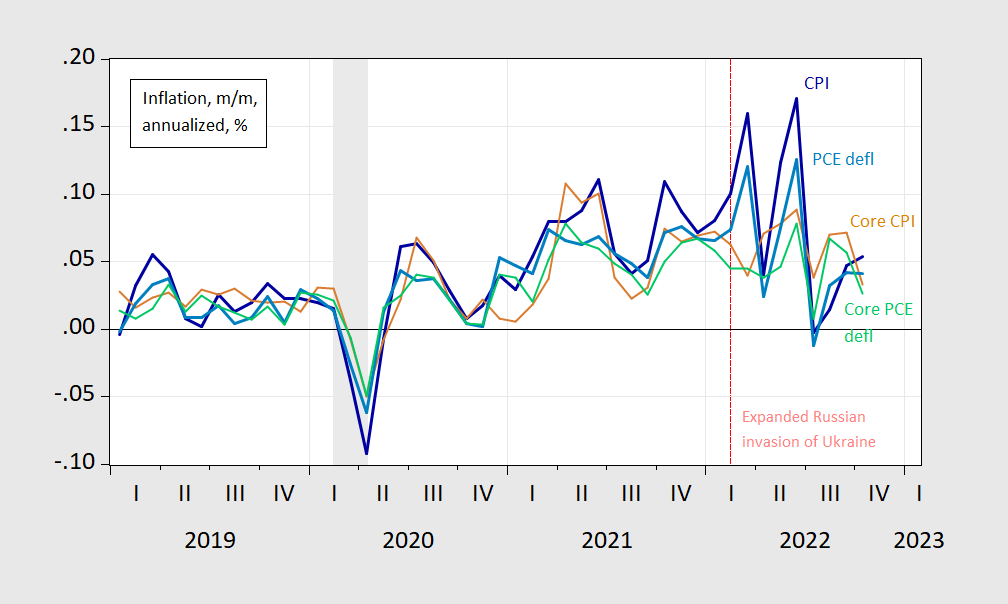
Figure 1: Month-on-month inflation annualized, for CPI (bold blue), core CPI (tan), PCE deflator (bold sky blue), and core PCE deflator (light green). NBER defined peak-to-trough recession dates shaded gray. Source: BLS, BEA via FRED, NBER, and author’s calculations.
And the quarter-on-quarter basis, the deceleration seems apparent, except perhaps for core CPI.
(Click on image to enlarge)
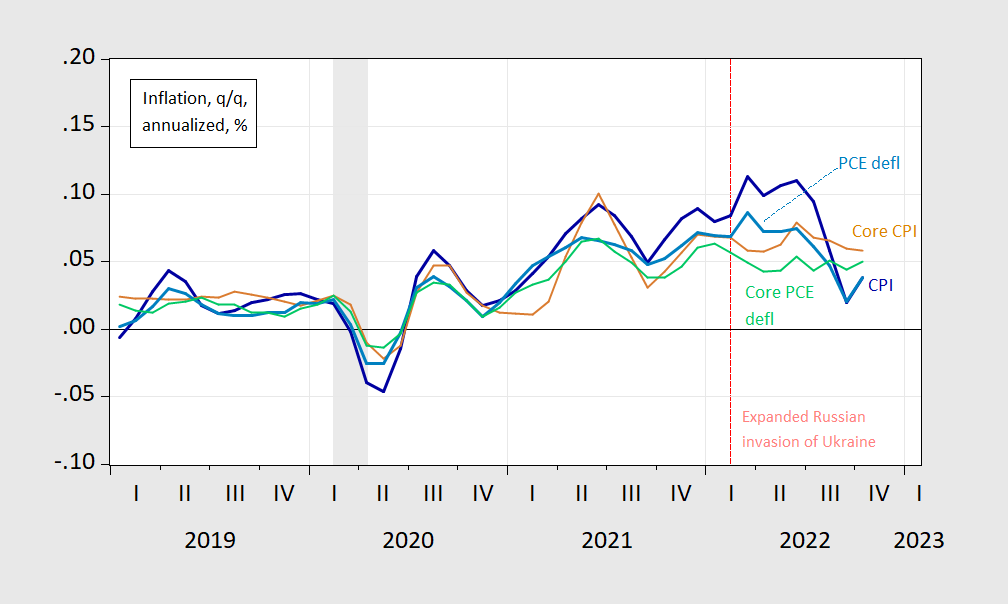
Figure 2: Quarter-on-quarter inflation annualized, for CPI (bold blue), core CPI (tan), PCE deflator (bold sky blue), and core PCE deflator (light green). NBER defined peak-to-trough recession dates shaded gray. Source: BLS, BEA via FRED, NBER, and author’s calculations.
While year-ahead Michigan household expectations of inflation are up slight in November (5.1% prel vs 5% in October), they are still down vs. March-April 2022 (5.4%).
More By This Author:
Business Cycle Indicators At The Beginning Of December 20222022Q3 2nd Release, Alternative Measures Of Activity, And A Recession Of 2022H1?
Maximum AUROC Term Spreads As Of November 25


Comments
Log in or sign up to join the conversation.