Elliott Wave Technical Analysis EUR/USD Hour Chart - Tuesday, September 12
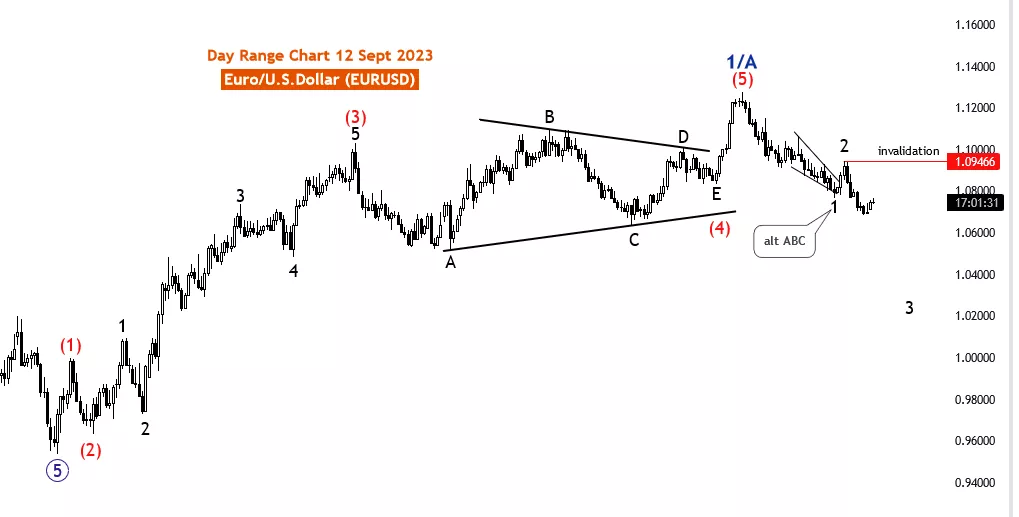
EURUSD Elliott Wave Analysis Trading Lounge Day Chart, 12 September 23
Euro/U.S.Dollar (EURUSD) Day Hour Chart
EURUSD Elliott Wave Technical Analysis
Function: Counter Trend
Mode: impulsive
Structure: black wave 3 of A
Position: wave A of 2/B
Direction Next lower Degrees: black wave 3 A continue
Details: black corrective wave 2 completed at 1.09466, now black wave 3 in play . Wave Cancel invalid level: 1.09466
The EURUSD Elliott Wave Analysis, dated 12 September 23, focuses on the daily chart of the Euro/U.S. Dollar currency pair (EURUSD). This analysis provides traders with valuable insights into potential market movements and wave patterns, applying the principles of Elliott Wave theory.
The analysis is categorized under the "Counter Trend" Function. This signifies that the primary objective is to identify potential counter trend movements within the market. Such insights are particularly useful for traders looking to capitalize on price reversals or corrections against the prevailing trend.
The Mode is described as "impulsive." This suggests that within the context of black wave 3 of A, a strong and forceful market movement is currently underway. Impulsive modes often indicate significant price action and trading opportunities that align with the prevailing trend.
The Structure identifies the market phase as black wave 3 of A. This provides clarity regarding the current position within the broader Elliott Wave pattern. It indicates that the market is currently navigating the third wave of wave A, which is valuable information for traders.
The Position details that the market is presently in wave A of 2/B, emphasizing its location within the broader Elliott Wave structure. Traders can utilize this information to understand the market's current status relative to the overall pattern.
The Direction Next Lower Degrees specifies that the market is continuing with black wave 3 of A. This particular wave is an essential component of the broader Elliott Wave pattern and is expected to persist.
In summary, the EURUSD Elliott Wave Analysis for 12 September 23, offers traders insights into potential counter trend movements within the EURUSD currency pair. By examining the Function, Mode, Structure, Position, and Direction, traders can gain a deeper understanding of the market's dynamics and potentially make informed trading decisions. However, as with any trading analysis, it's crucial to supplement this information with additional technical and fundamental indicators for comprehensive trading decisions and effective risk management.
(Click on image to enlarge)

More By This Author:
Elliott Wave Technical Analysis Day Chart - Euro/British Pound
Elliott Wave Technical Analysis: Interactive Brokers Group Inc.
Elliott Wave Technical Analysis 4 Hour Chart - Euro/British Pound
Analyst Peter Mathers TradingLounge™ Australian Financial Services Licence - AFSL 317817


