

Image Source: Unsplash
Elliott Wave Technical Analysis: Interactive Brokers Group Inc.
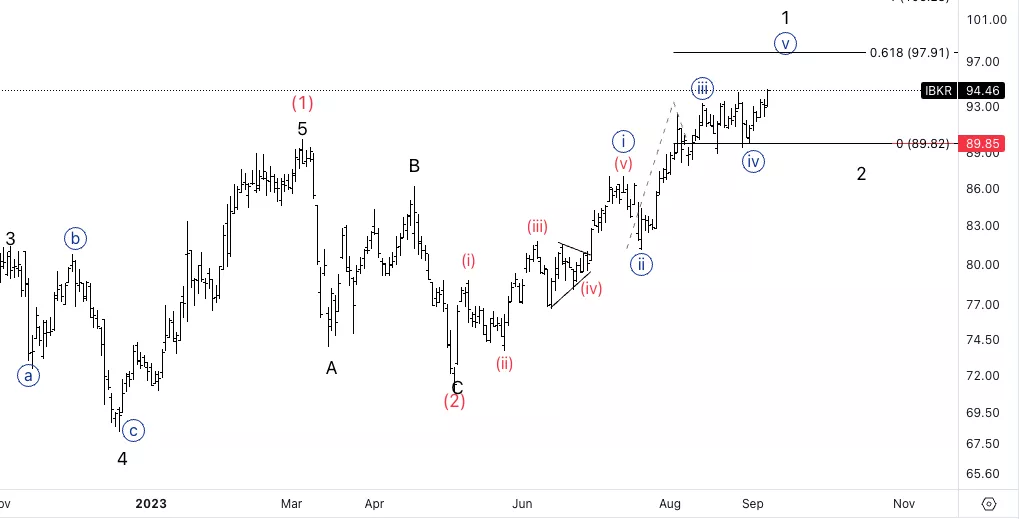
Interactive Brokers Group Inc., (Nasdaq: IBKR): Daily Chart, 11 September 2023
IBKR Stock Market Analysis: We have been looking for continuation higher and we are starting to move higher as anticipated. Looking for upside target at around 98$ where we have 0.618 {v} vs. {i}.
IBKR Elliott Wave Count: Wave {v} of 1.
IBKR Technical Indicators: Above all averages.
IBKR Trading Strategy: Looking for short-term longs into wave {v}.
Analyst: Alessio Barretta
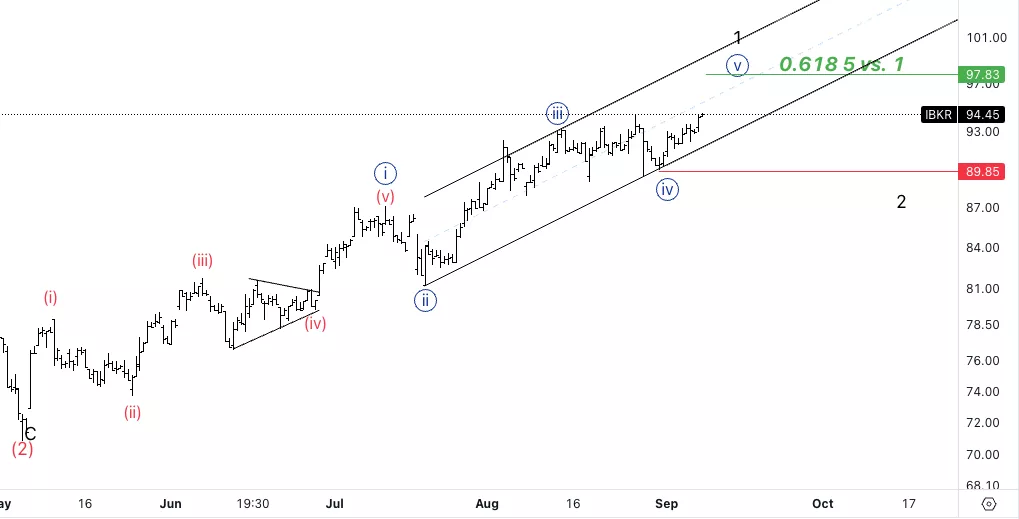
Interactive Brokers Group Inc., IBKR: 4-hour Chart 11 September 2023
Interactive Brokers Group Inc., Elliott Wave Technical Analysis
IBKR Stock Market Analysis: As wave {iii} was shorter than {i} we need wave {v} to be shorter than {iii} which is why upside target is 0.618 and not equality. We could also be finding resistance on the middle line of the base channel(blue dotted line).
IBKR Elliott Wave count: Wave {v} of 1.
IBKR Technical Indicators: Above all averages.
IBKR Trading Strategy: Looking for short-term longs into wave {v}.
More By This Author:
Elliott Wave Technical Analysis Day Chart - Euro/British Pound
Elliott Wave Technical Analysis: Polkadot, Monday, September 11
Elliott Wave Analysis Of Major Indices


Comments
Log in or sign up to join the conversation.