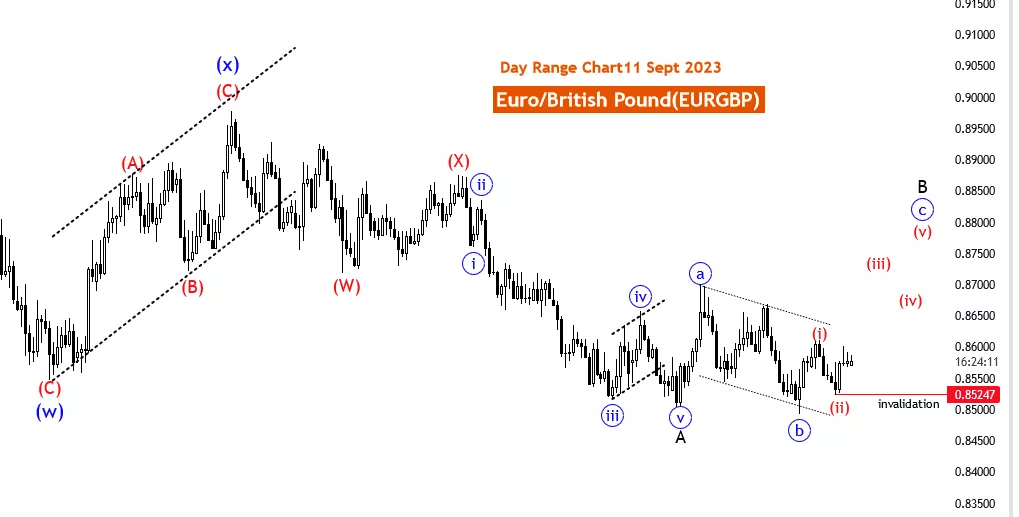
Elliott Wave Technical Analysis Day Chart - Euro/British Pound

Photo by Colin Watts on Unsplash
EURGBP Elliott Wave Analysis Trading Lounge Day Chart, 11 September 2023
Euro/British Pound (EURGBP) Day Chart
EURGBP Elliott Wave Technical Analysis
Function: Counter-Trend
Mode: impulsive in blue wave C
Structure: C of black wave B
Position: Wave B of Y
Direction Next lower Degrees: Black wave C of Y
The EURGBP Elliott Wave Analysis conducted on 11 September 23, focuses on the daily chart of the Euro/British Pound currency pair (EURGBP). This analysis aims to provide traders with valuable insights into potential market movements and wave patterns based on the Elliott Wave theory.
The primary function of this analysis is categorized as Counter Trend. This suggests that the analysis is primarily concerned with identifying potential counter-trend movements within the market. Counter-trend analysis is crucial for traders who seek opportunities to capitalize on price corrections or reversals against the prevailing trend.
The Mode of the analysis is described as impulsive in blue wave C. This indicates that within the corrective structure represented by black wave B, a strong and forceful market movement is currently underway. Impulsive modes often suggest significant price action and trading opportunities that align with the prevailing corrective wave.
The Structure is identified as C of black wave B. This provides insights into the current phase within the broader Elliott Wave pattern. Specifically, it signifies that the market is presently within the C wave of the larger black wave B. Understanding the market's position within this Elliott Wave structure is essential for traders to make informed decisions.
The Position information highlights that the market is currently within Wave B of Y, indicating its position within the larger corrective pattern. This insight helps traders comprehend the market's current position within the overall Elliott Wave structure.
The Direction Next Lower Degrees specifies that the market is presently in Black wave C of Y. This information prepares traders for the continuation of the corrective phase within the broader Elliott Wave pattern.
In summary, the EURGBP Elliott Wave Analysis for 11 September 23, provides traders with insights into potential counter-trend movements within the EURGBP currency pair. By examining the Function, Mode, Structure, Position, and Direction, traders can gain a better understanding of the market's dynamics and potentially make informed trading decisions. However, as with any trading analysis, it's crucial to use additional technical and fundamental indicators to make well-rounded trading decisions and effectively manage risks.

More By This Author:
Elliott Wave Analysis Of Major Indices
Elliott Wave Technical Analysis Analog Device Inc - Friday, 8 September
Elliott Wave Technical Analysis TRX/USD
Analyst Peter Mathers TradingLounge™ Australian Financial Services Licence - AFSL 317817


