Elliott Wave Technical Analysis Analog Device Inc - Friday, 8 September
Analog Device Inc., Elliott Wave Technical Analysis
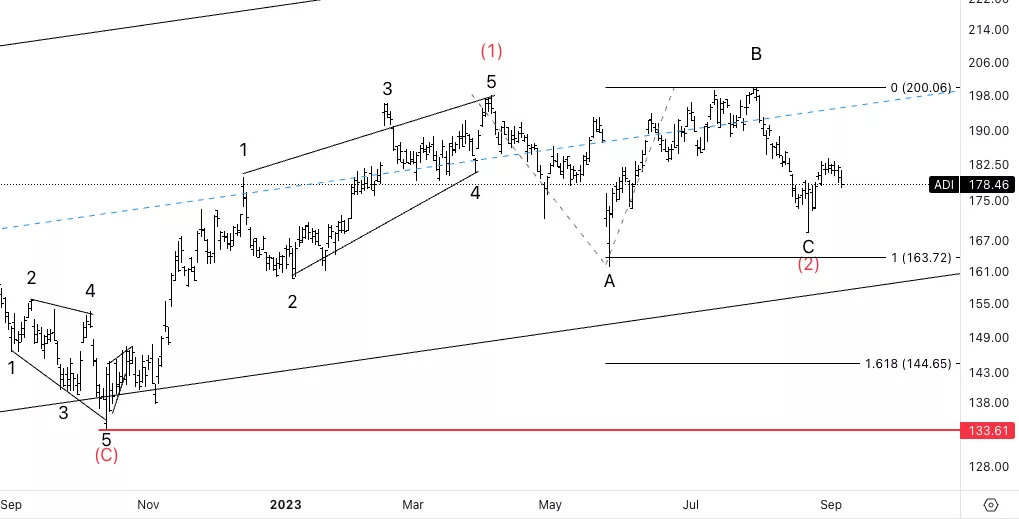
Analog Device Inc., (ADI:NASDAQ): Daily Chart, 8 September 23
ADI Stock Market Analysis: We are looking at a potential three wave move into wave (2) to ten resume the overall upside trend into ATH. We failed to reach quality of C vs. A, but we found support from 165$ and we are now seeing resistance on 180$.
ADI Elliott Wave Count: Wave 1 of (3).
ADI Technical Indicators: Between 20 and 200EMA.
ADI Trading Strategy: Looking for longs into wave (3) after upside confirmation.
(Click on image to enlarge)

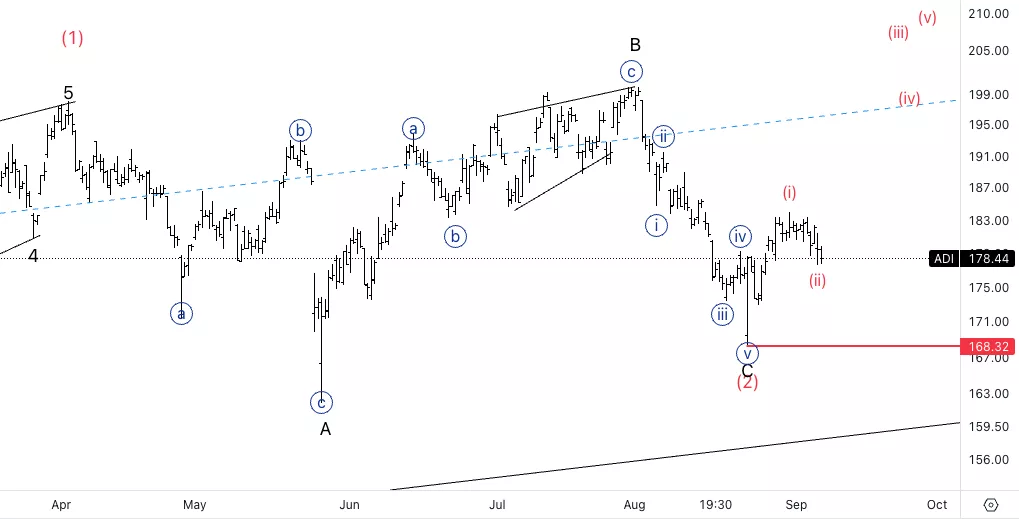
Analog Device Inc., ADI: 4-hour Chart, 8 September 23
Analog Device Inc., Elliott Wave Technical Analysis ADI Stock Market Analysis: Looking for a potential wave (i) as we could count five waves off the bottom. However there is also a case for a three wave move. Looking to found support within 180$ to then continue higher.
ADI Elliott Wave count: Wave (i) of {i}.
ADI Technical Indicators: Below all averages.
ADI Trading Strategy: Looking for longs after support on 180$.
(Click on image to enlarge)

More By This Author:
Commodities & Futures Market Analysis: Insights & Strategies
US Stock Market Report - Elliott Wave Analysis
Elliott Wave Technical Analysis: Monster Beverage Corp. - Thursday, Sept. 7
Analyst Peter Mathers TradingLounge™ Australian Financial Services Licence - AFSL 317817


