

Image Source: Pexels
As of 2nd release for 2025Q1.
(Click on image to enlarge)
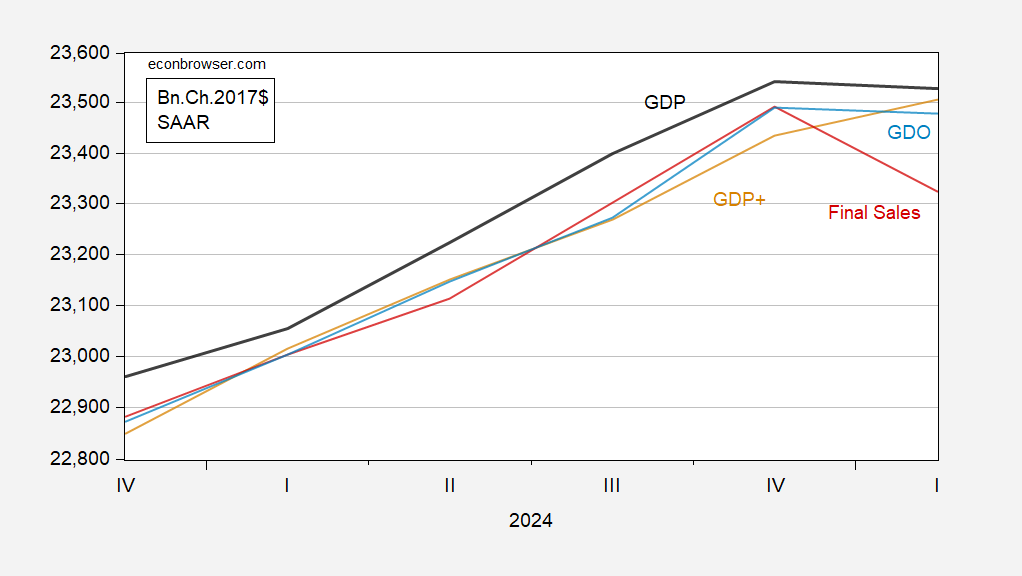
Figure 1: GDP (bold black), GDO (light blue), GDP+ based on 2022Q4 GDP (tan), final sales (red), all in bn.Ch.2017$ SAAR. Source: BEA 2025Q1 2nd release, Philadelphia Fed, and author’s calculations.
Final sales growth revised down 0.3 ppts, as consumption growth revised down 0.6 ppts. All in all, the outlook looks less rosy than in the advance release, as inventory growth are up revised up 0.3 ppts. Remember, final sales more closely approximates aggregate demand than does GDP.
More By This Author:
What Does A Rising Long Term U.S. Government Yield Mean?
Weekly Indicators Of GDP Growth
Furniture Prices Up, Up And Away In April


Comments
Log in or sign up to join the conversation.