
Larger and larger gross cross-border holdings lead to bigger swings in the NIIP to GDP ratio.
(Click on image to enlarge)
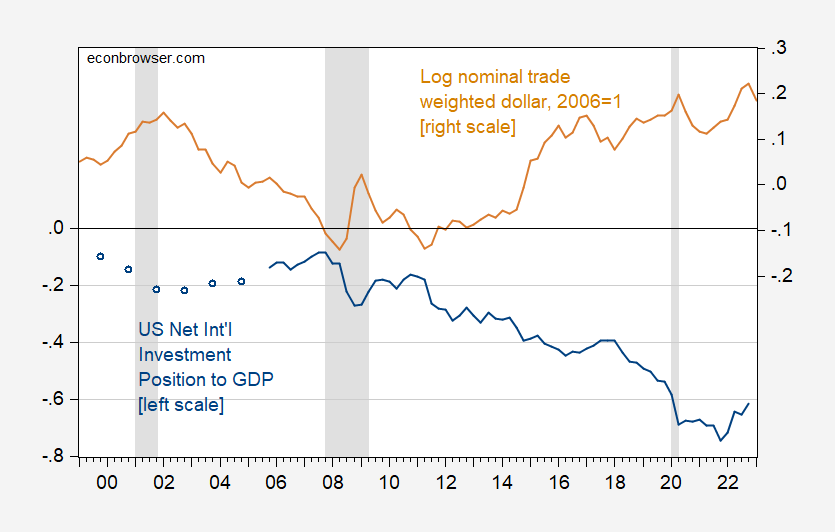
Figure 1: Net international investment position to GDP ratio (blue, left scale), and nominal value of US dollar against broad basket of currencies (tan, right scale). NBER defined peak-to-trough recession dates shaded gray. Source: BEA, Federal Reserve via FRED, NBER, and author’s calculations.
This is because US assets held abroad are denominated in foreign currency; expressing everything in US dollars incorporates those swings in the dollar’s exchange rate to asset valuations.
For more discussion of the US NIIP, see this discussion of a CBO working paper.
More By This Author:
Assessing The Cross-Taiwan-Straits Military Balance
Credit Easing/Tightening/Easing/? 2007-2023
Weekly Macro Indicators Through April 8


Comments
Log in or sign up to join the conversation.