
Here are some macro indices at the weekly frequency for the real economy.
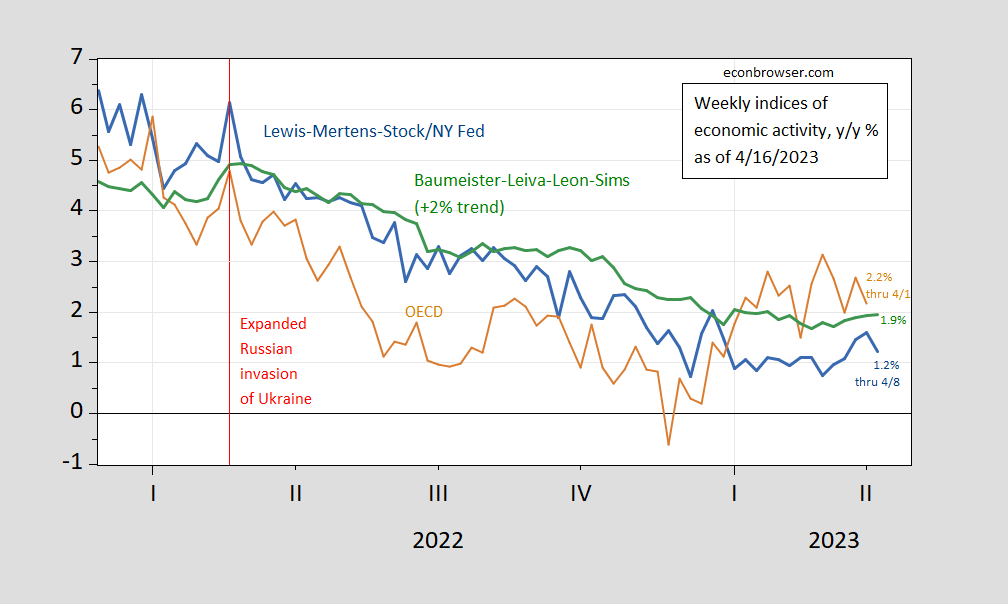
Figure 1: Lewis-Mertens-Stock Weekly Economic Index (blue), OECD Weekly Tracker (tan), Baumeister-Leiva-Leon-Sims Weekly Economic Conditions Index for US plus 2% trend (green), S&P Market Intelligence monthly GDP (blue bar), all growth rate in %. Source: NY Fed via FRED, OECD, WECI, accessed 4/16, and author’s calculations.
The Weekly Tracker was not updated, so I repeat the growth at 2.2% for the week ending April 1. The WECI+2% through April 8 is (1.9%), while WEI reading is 1.2%. The latter is interpretable as a year-over-year quarter growth of 1.2% if the 1.2% reading were to persist for an entire quarter.
The Baumeister et al. reading of -0.1% is interpreted as a 0.1% growth rate in below the long-term trend growth rate. Average growth of US GDP over the 2000-19 period is about 2%, so this implies a 1.9% growth rate for the year ending April 8.
Recall the WEI relies on correlations in ten series available at the weekly frequency (e.g., unemployment claims, fuel sales, retail sales), while the WECI relies on a mixed frequency dynamic factor model. The Weekly Tracker is a “big data” approach that uses Google Trends and machine learning to track GDP. As such, it does not rely on actual economic indices per se.
More By This Author:
Inflation And Costs, One Year Ahead: What Do Businesses Think?One-Year CPI Inflation Expectations
CPI Inflation In March: Downward, Month-On-Month


Comments
Log in or sign up to join the conversation.