
Final May figures for Michigan survey are out. As noted in the release, final figures are more positive with the inclusion of post-pause responses. Here’s the picture of confidence and sentiment, updated.
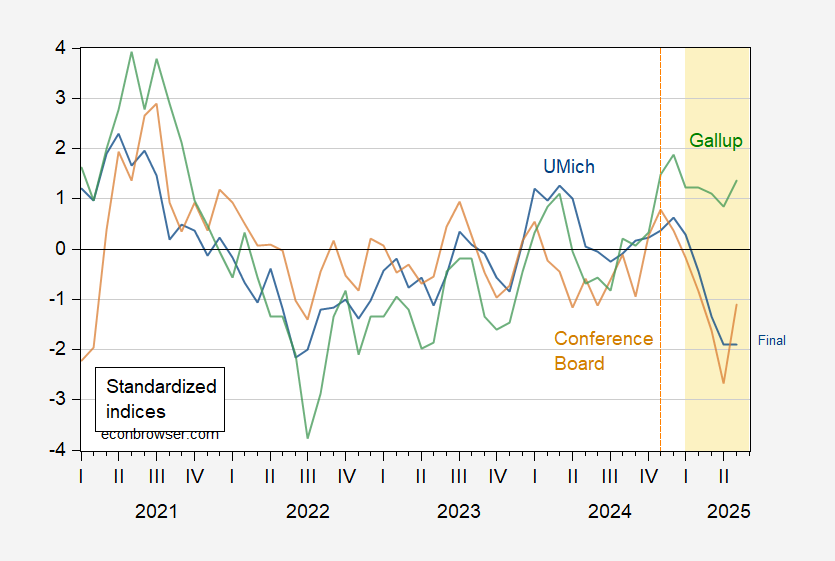
Figure 1: U.Michigan Economic Sentiment (blue), Conference Board Confidence Index (brown), Gallup Confidence (green), all demeaned and divided by standard deviation 2021M01-2025m02. Source: UMichigan, Gallup, Conference Board, and author’s calculations.
How much worse did the U.Michigan expectations index look in the preliminary release?
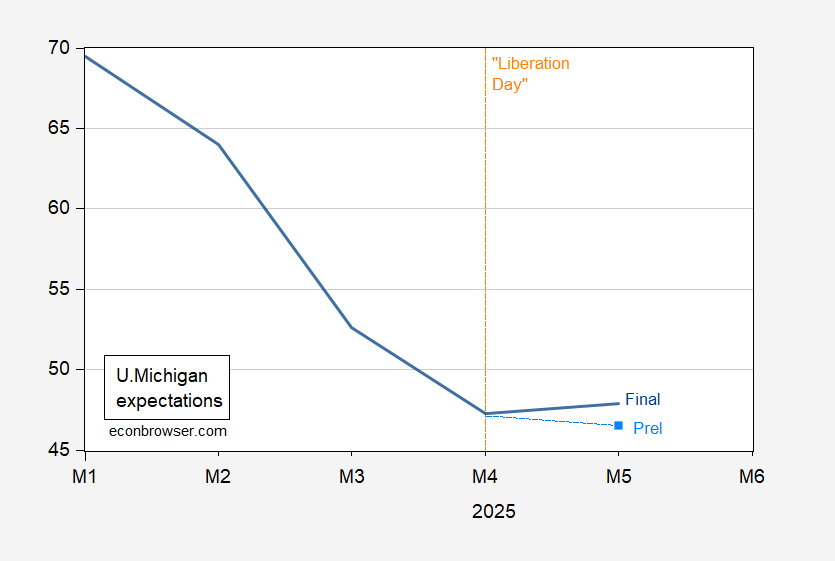
Figure 2: U.Michigan expectations, final (dark blue), and preliminary for May (light blue square). Source: U.Michigan.
Not that much worse – expectations had declined substantially even before May.
More By This Author:
Business Cycle Indicators As Reported At May’s End
Economic Activity: GDP, GDO, GDP+, Final Sales
What Does A Rising Long Term U.S. Government Yield Mean?


Comments
Log in or sign up to join the conversation.