

Real defense spending is higher than at the Reagan buildup, but is (much) lower as a ratio of real GDP.
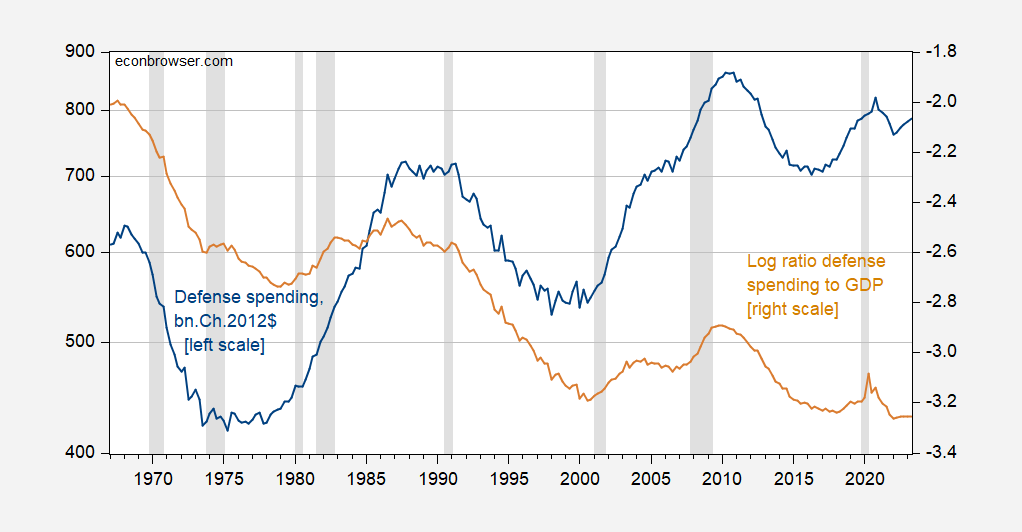
Figure 1: Defense spending in billions Ch.2012$ SAAR, on log scale (blue, left scale), and as a log ratio to GDP (tan, right scale). NBER defined peak-to-trough recession dates shaded gray. Source: BEA 2023Q2 advance release, NBER, and author’s calculations.
More By This Author:
GDP, GDO, GDP+
Business Cycle Indicators At July’s End
Still Chugging Along


Comments
Log in or sign up to join the conversation.