
The Bureau of Economic Analysis announced that seasonally adjusted U.S. real GDP grew at a 2.4% annual rate in the second quarter, not far from the historical average of 3.1%.
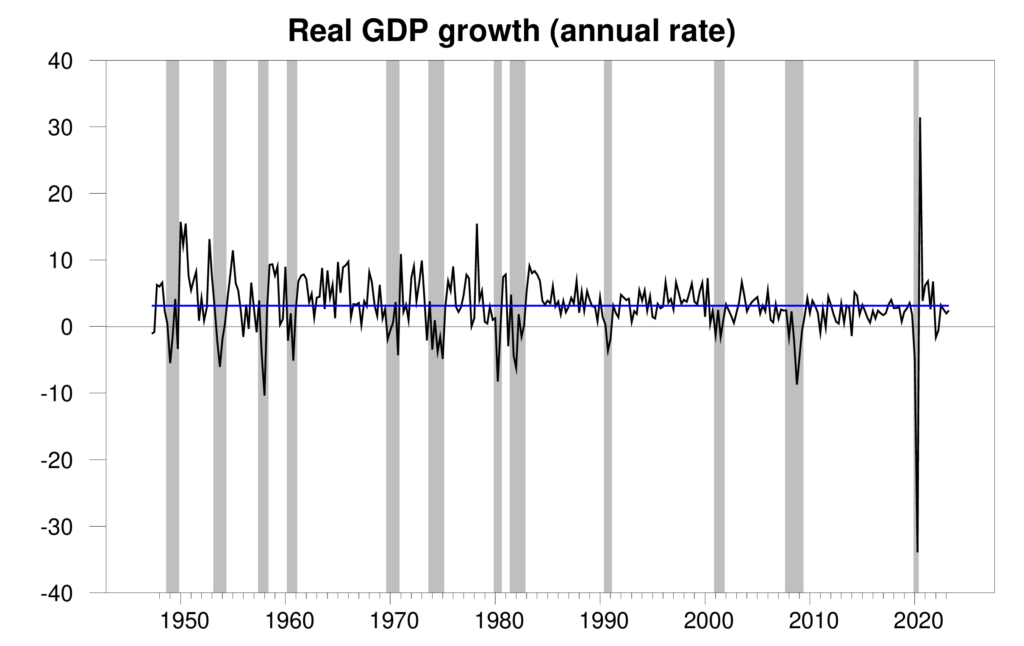
Real GDP growth at an annual rate, 1947:Q2-2023:Q2, with the historical average (3.1%) in blue. Calculated as 400 times the difference in the natural log of GDP from the previous quarter.
The new data put the Econbrowser recession indicator index at 4.9%, reflecting essentially no recession signal. Staff at the Federal Reserve and the Congressional Budget Office are no longer predicting a recession. Maybe Godot ain’t coming?
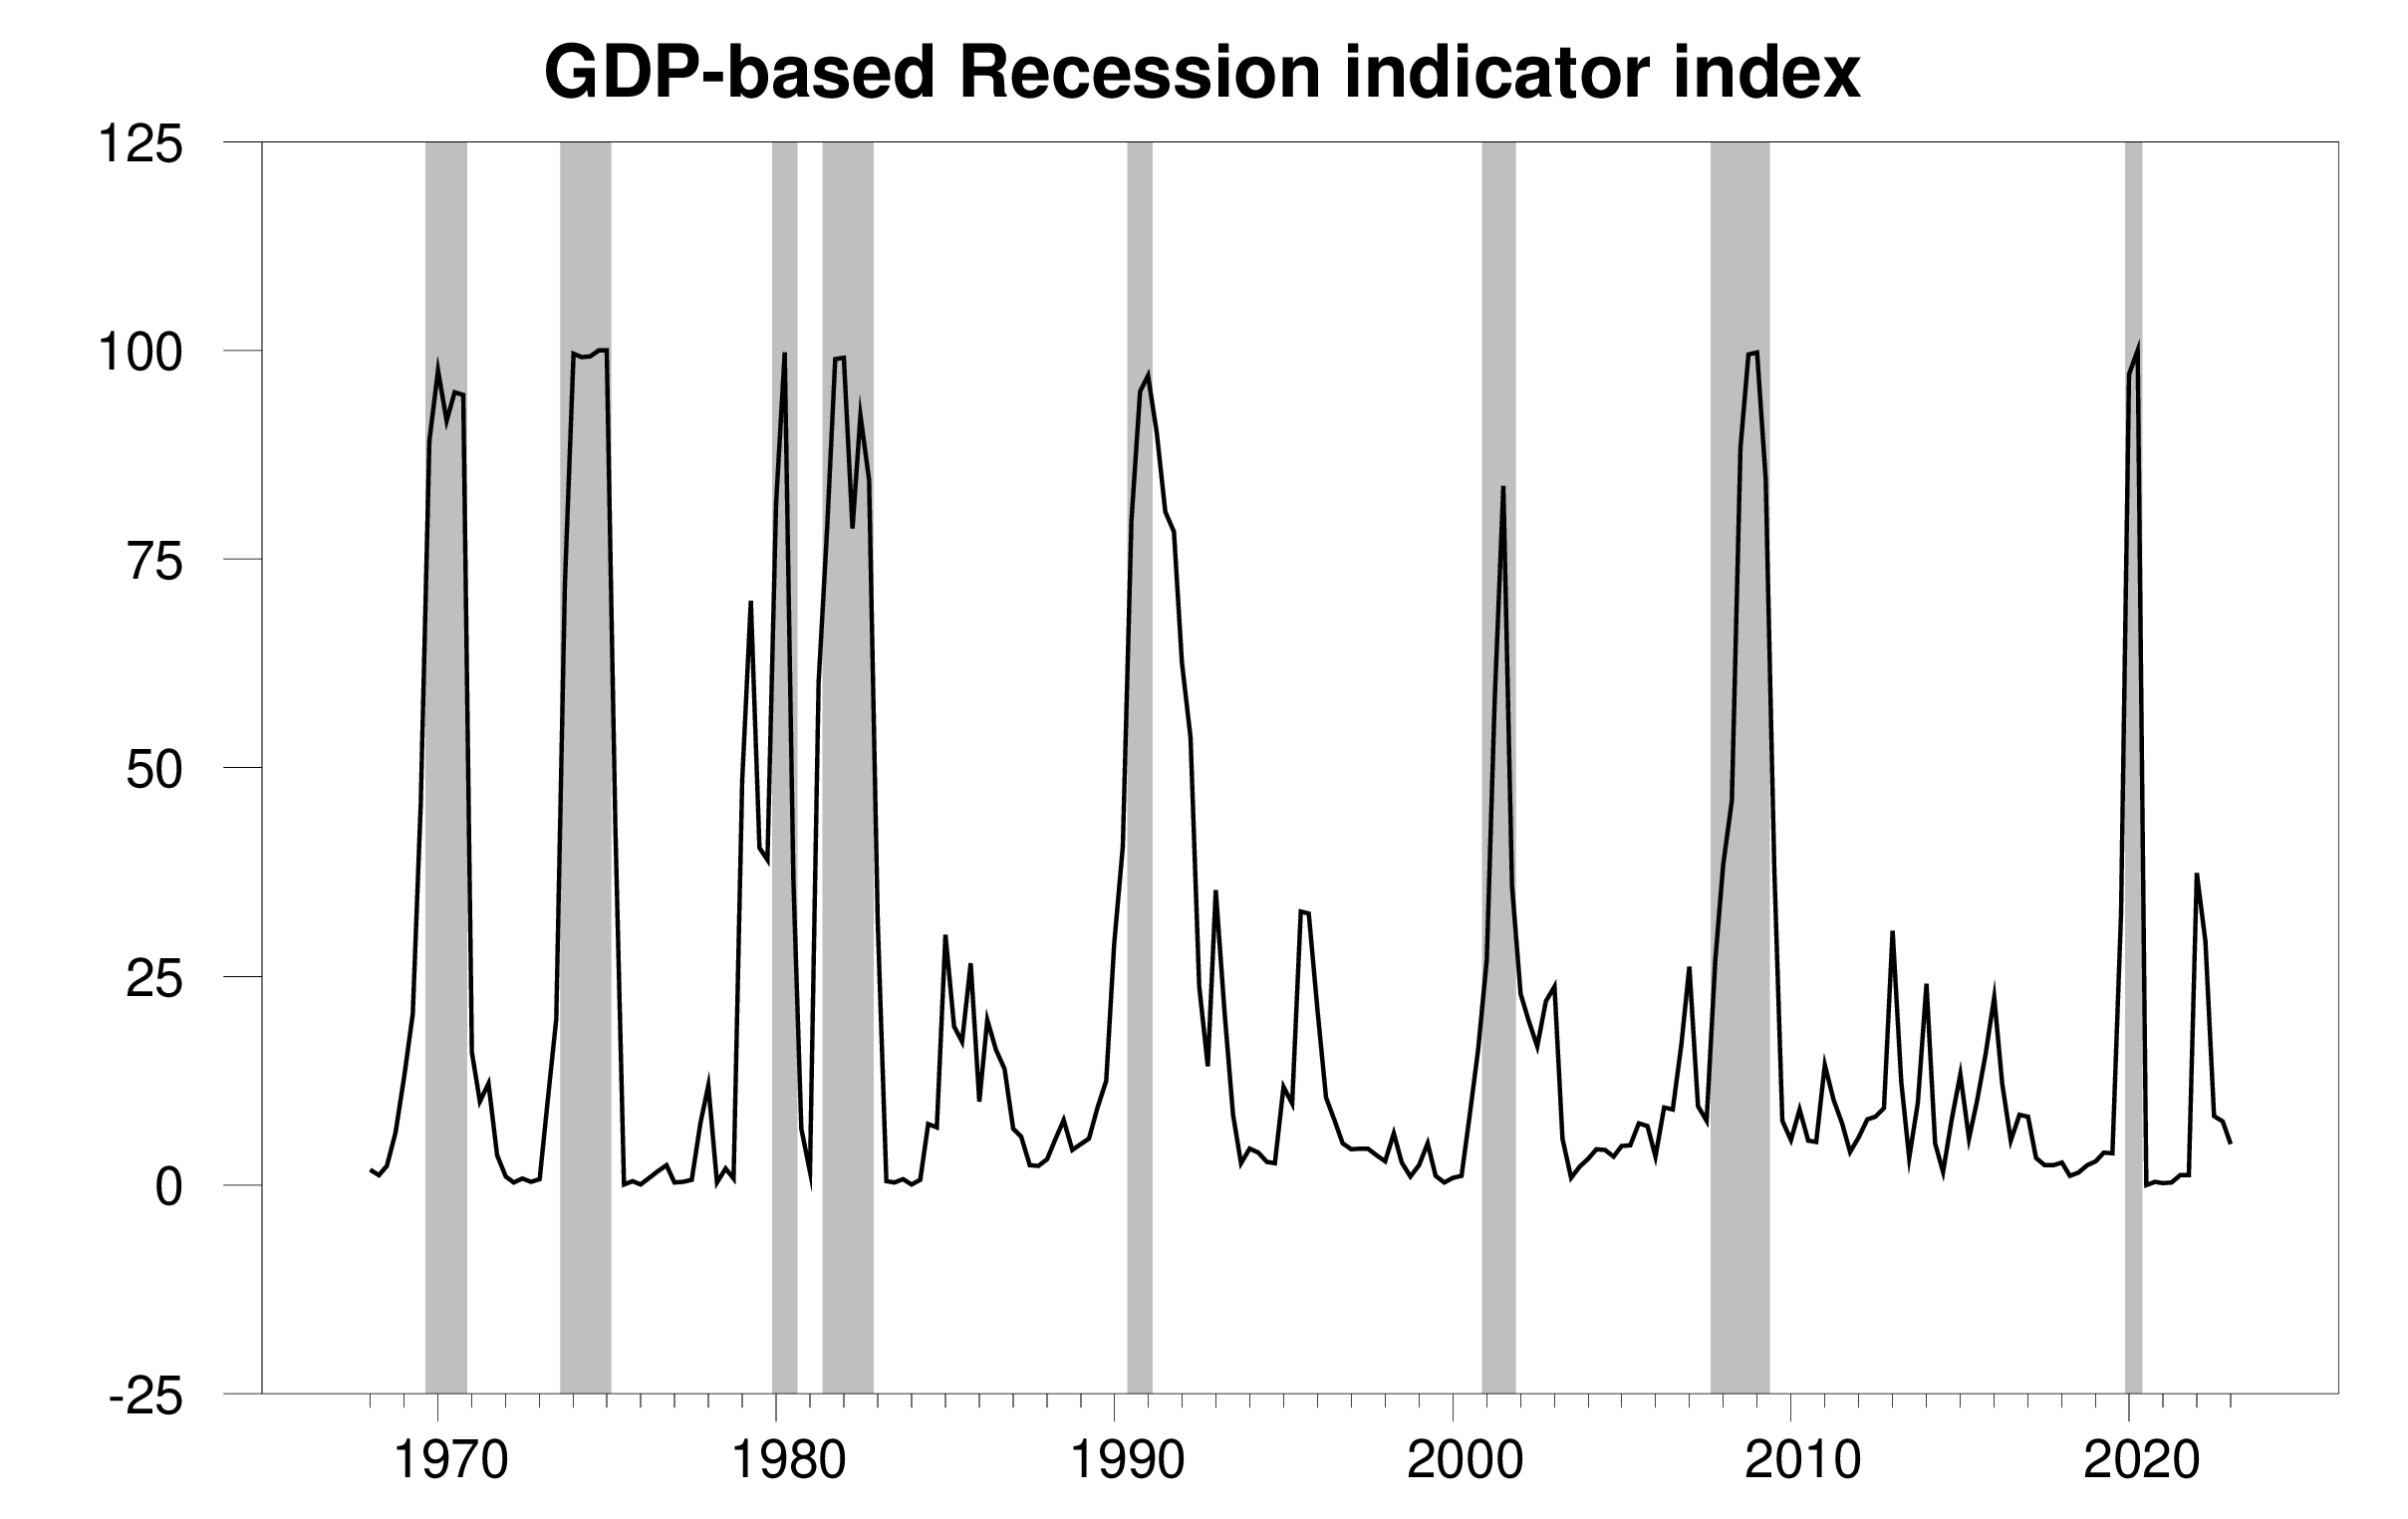
GDP-based recession indicator index. The plotted value for each date is based solely on the GDP numbers that were publicly available as of one quarter after the indicated date, with 2023:Q1 the last date shown on the graph. Shaded regions represent the NBER’s dates for recessions, which dates were not used in any way in constructing the index.
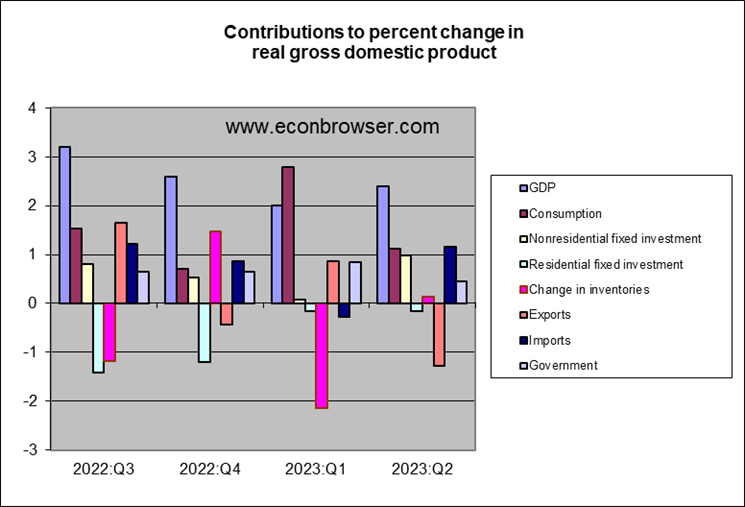
Growth was boosted by surprisingly strong nonresidential fixed investment. A drop in exports was almost all offset by a similar drop in imports.
Housing, which we’d expect to bear the brunt of the Fed’s effort to slow the economy, continued to be a modest drag on GDP, but much less so than in the first two quarters of this year. Looking at housing construction as a percent of GDP, all the stimulus since 2020 has been undone, and we currently stand somewhat below the historical average.
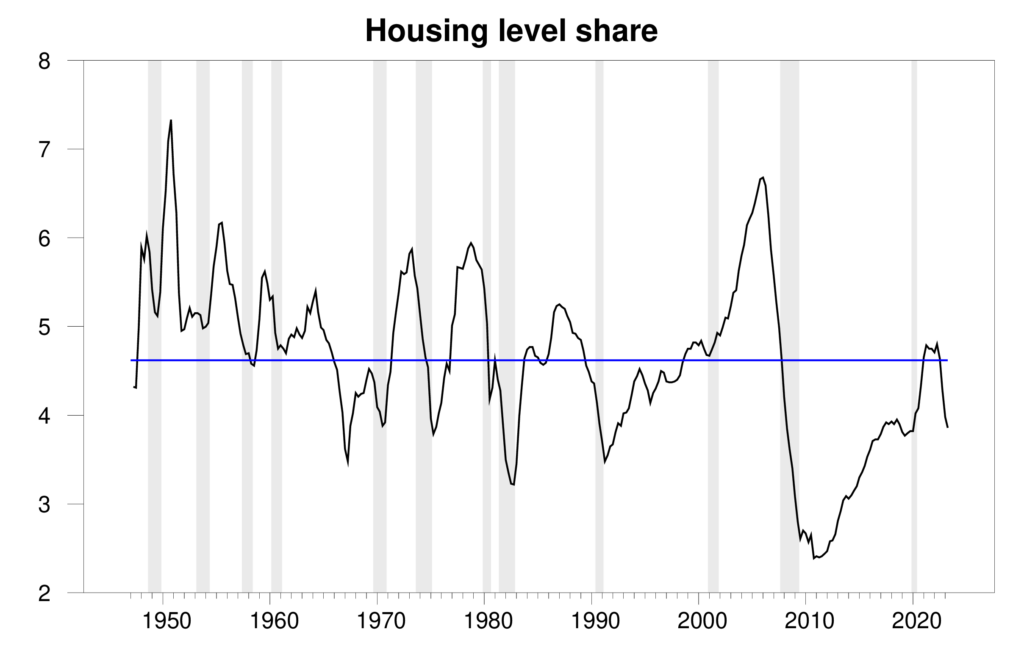
Residential fixed investment as a percentage of nominal GDP. Blue line represent historical average of 4.6%. Data source: BEA Table 1.5.5.
As Jeff Frankel says, maybe this is what a soft landing would look like.
More By This Author:
CVO Projection Defers The DownturnA Search For A Phillips Curve In China
GDP, GDI, GDO, GDP+


Comments
Log in or sign up to join the conversation.