
Following futures positions of non-commercials are as of August 9, 2022.
10-year note: Currently net short 286.5k, down 9k.
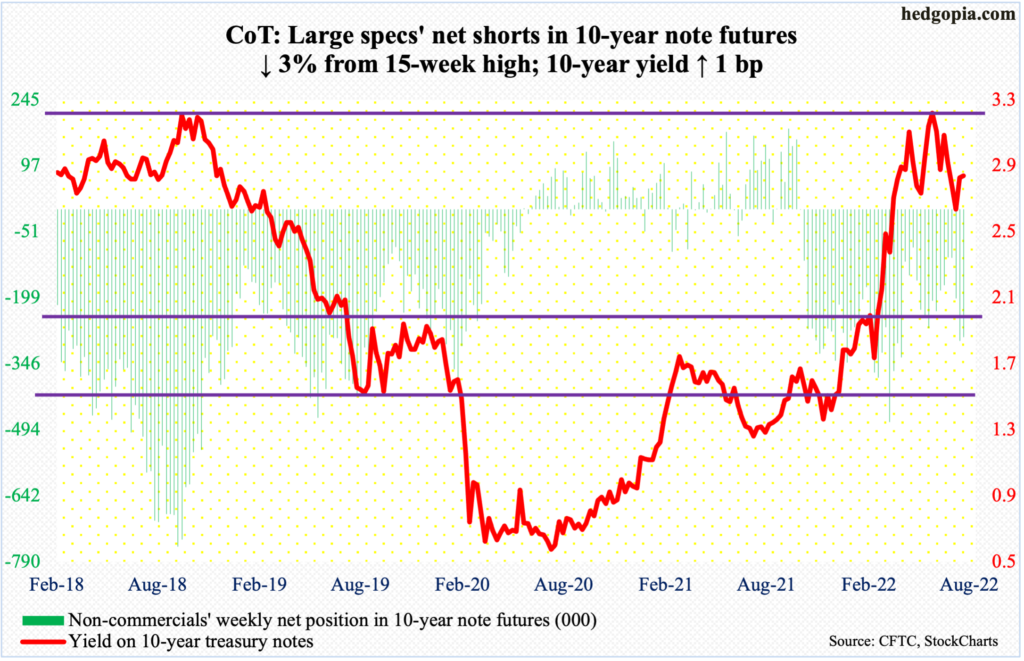
Non-commercials slightly cut back net shorts in 10-year note futures. At 286,478 contracts, holdings remain elevated. In the week before, as of August 2, these were 295,490 – a 15-week high and up from only 108,704 two weeks before that.
It so happens the 10-year treasury yield bottomed at 2.53 percent on August 2 as well. Earlier, rates hit a high of 3.48 percent on June 14. When the 10-year put in that low on the 2nd, the daily was pushed into oversold territory.
Now, it is show-me time. The oversold condition on the daily has just about been unwound, and yields could very well go the other way. Last week’s reduction – albeit slight – in 10-year note futures could very well be a sign of things to come as far as non-commercials’ net shorts are concerned.
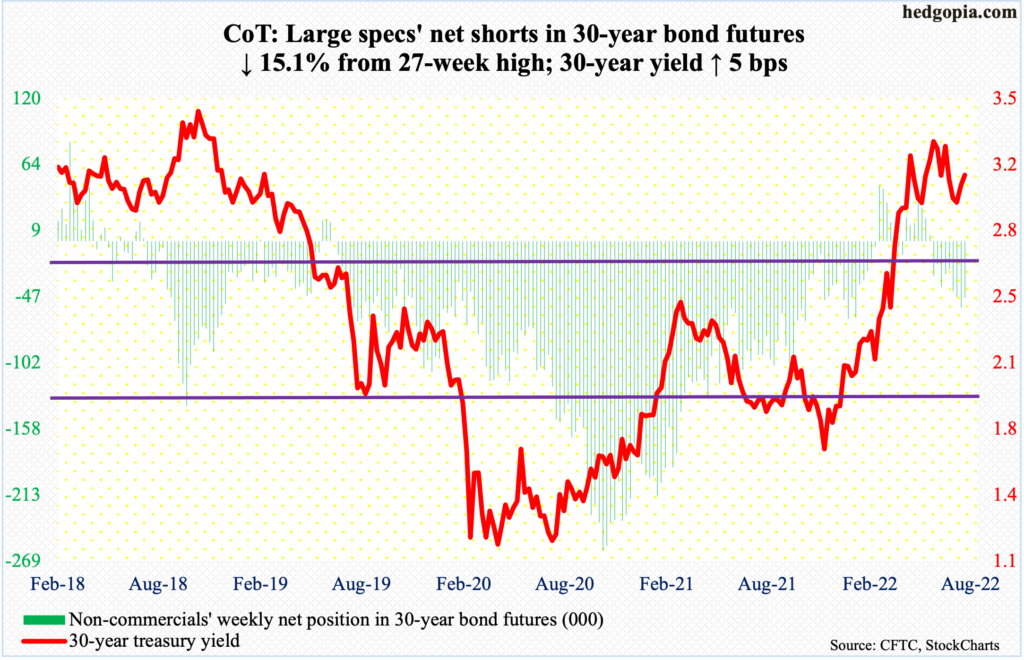
30-year bond: Currently net short 47.6k, down 8.5k.
Major economic releases for this week are as follows.
The NAHB housing market index (August) and Treasury International Capital data (June) are due out today.
Homebuilder optimism tumbled 12 points month-over-month to 55 in July – a 26-month low.
In the 12 months to May, foreigners sold $181.1 billion in US stocks; they switched to a net seller in January. In March last year, they were net buyers of record $404.7 billion.
Housing starts (July) and industrial production (July) are scheduled for Tuesday.
Starts fell two percent m/m in June to a seasonally adjusted annual rate of 1.56 million units, which matched last September’s reading.
Capacity utilization in June dropped 0.4 percent m/m to 80 percent. April’s 80.4 percent was the highest since March 2008.
Retail sales (July) are on dock for Wednesday. In June, sales grew one percent m/m to $680.6 billion – a new record.
Thursday brings existing home sales (July). June sales were down 5.4 percent m/m to 5.12 million units – a two-year low.
WTI crude oil: Currently net long 231.3k, down 21.7k.
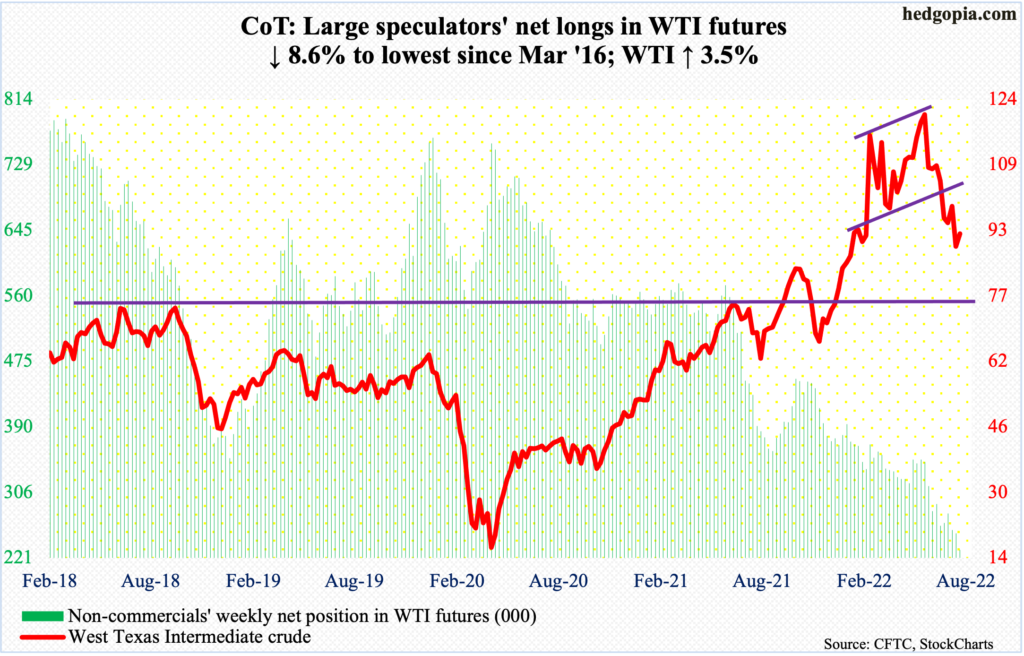
After losing horizontal support at $93-$94 a couple of weeks ago, oil bulls attempted to reclaim the level last week, rallying as high as $95.05 on Thursday but only for sellers to show up. The 200-day lied there as well, with the average also offering resistance on Friday. In the end, WTI finished the week at $92.09/barrel, up 3.5 percent.
There is crucial lateral support at $85, or just underneath, and this likely gets tested in the sessions ahead.
In the meantime, per the EIA, US crude production in the week to August 5 grew 100,000 barrels per day to 12.2 million b/d. Stocks of crude and distillates increased as well, respectively up 5.5 million barrels and 2.2 million barrels to 432 million barrels and 111.5 million barrels. Gasoline inventory, however, dropped five million barrels to 220.3 million barrels. As did crude imports, which decreased 1.2 mb/d to 6.2 mb/d. Refinery utilization rose 3.3 percentage points to 94.3 percent.
E-mini S&P 500: Currently net short 244.3k, up 12.4k.
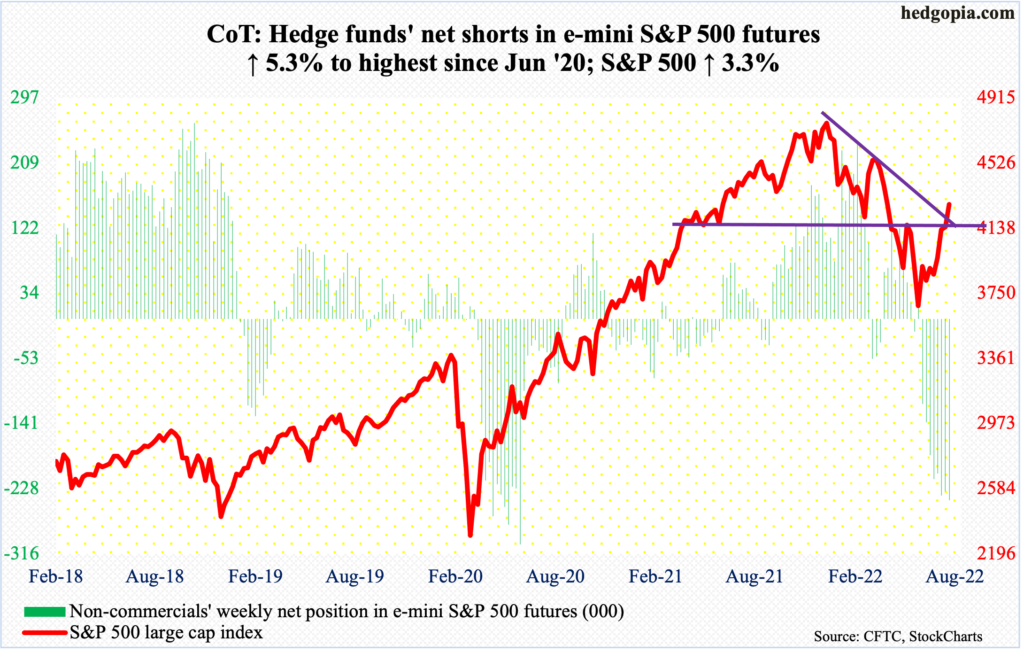
Equity bulls started out slow but were strong in the last three sessions, with the week ending up 3.3 percent. This was the fourth consecutive up week and sixth in the last eight.
Flows were decent in the week to Wednesday, with US-based equity funds taking in $4.4 billion (courtesy of Lipper) and SPY (SPDR S&P 500 ETF), VOO (Vanguard S&P 500 ETF) and IVV (iShares Core S&P 500 ETF) attracting $5.8 billion (courtesy of ETF.com).
The S&P 500 (4280) broke through dual resistance – horizontal and trend-line resistance at 4150s. Trend-line resistance from January’s record high 4819 lies at 4300. If this falls, then 4367 is the next level to watch; this is where the large cap index will have retraced 61.8 percent of the decline between January’s high and June’s low of 3637; this is an important Fibonacci number and bears watching. Shorts could reload here.
Euro: Currently net short 34.5k, down 4.3k.
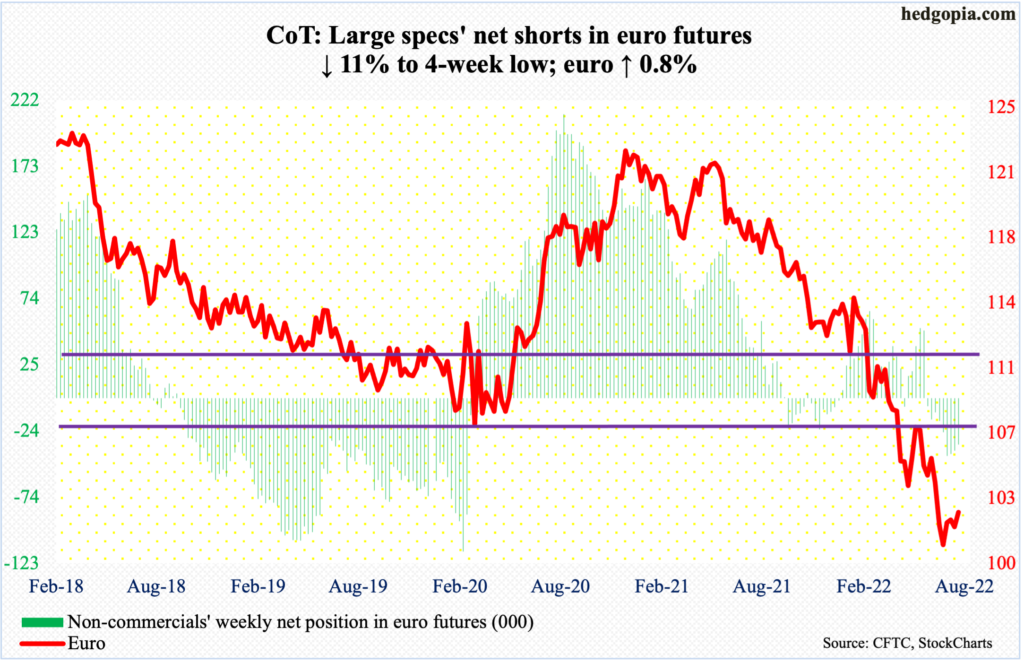
On both Wednesday and Thursday, euro bulls went after straight-line resistance $1.0350s, which was lost early July. If reclaimed, this would also have filled a July 5 gap. Bulls had momentum on their side as the currency had been consolidating around $1.0250s following a July 14 bottom at $0.9952. Earlier, the euro peaked at $1.2345 in January last year.
Bulls’ attempt, however, came up short, as sellers showed aggression around $1.0350s, which also approximate the 50-day at $1.0340.
The daily is now itching to go lower. The Bollinger bands on this timeframe are tightening, with the lower band at $1.0116.
Gold: Currently net long 142.9k, up 18.5k.
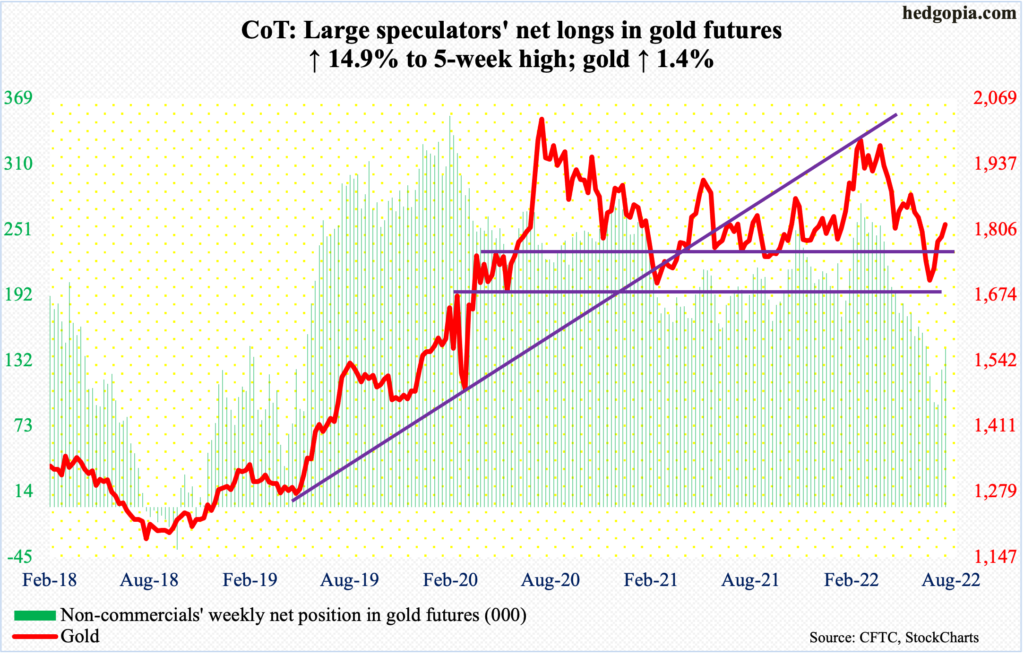
July’s hammer candle defended crucial support at $1,670s. Since then, gold ($1,815/ounce) has risen for four consecutive weeks, including last week when it rose 1.4 percent.
In the process, the metal reclaimed $1,760s-$1,770s early this month, but has since hovered just above the level, not able to get much traction.
The 200-day ($1,842) is right above, with the 50-day ($1,789) underneath. A test of the latter is more likely in the sessions ahead.
Nasdaq 100 index (mini): Currently net long 21.1k, down 3.6k.
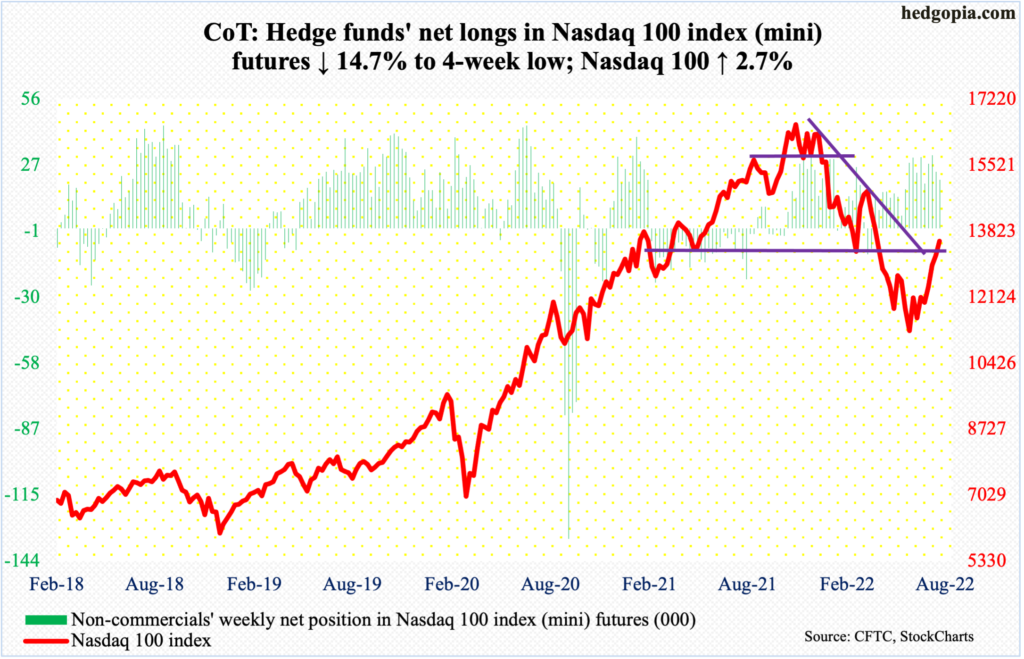
The Nasdaq 100 rallied a rather subdued 2.7 percent last week – its fourth straight up week and sixth in the last eight. Tech bulls reloaded after a successful test of the 10-day on Tuesday.
From the June 16 low of 11037, the index (13566) has rallied just under 23 percent. Earlier, it plunged 34.2 percent from last November’s record high 16765. A 50-percent retracement of this decline lies at 13901, which also approximates horizontal resistance. The 200-day at 14056 is just above.
Russell 2000 mini-index: Currently net short 112.9k, down 7.1k.
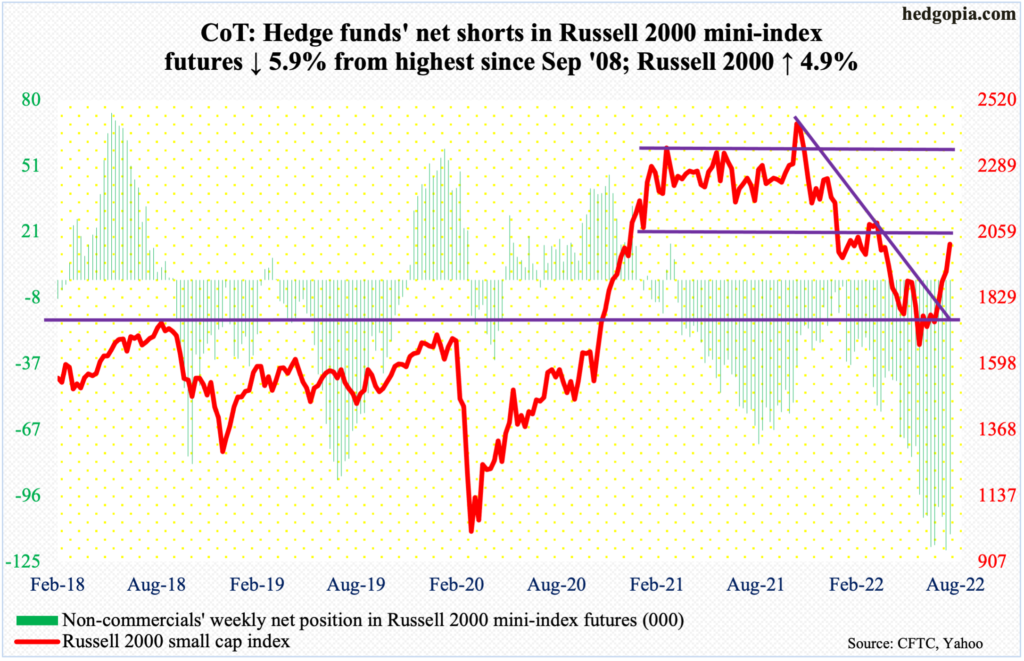
Non-commercials reduced a tad net shorts in Russell 2000 mini-index futures which until the prior week had risen to the highest since September 2008. Small-cap bulls are eyeing this and salivating. But for a meaningful short-covering to occur, bulls also need to deliver.
They have done that the past couple of months, having had a successful breakout retest at 1700 between mid-June and mid-July. This was then followed by the reclaiming of 1900 early this month. Last week, the Russell 2000 (2017) jumped 4.9 percent. It is possible non-commercials cut back more in the last three sessions, as their holdings are as of Tuesday. If so – and should this continue – the next level to watch is 2080s, which will represent a test of a broken range.
US Dollar Index: Currently net long 38.6k, down 710.
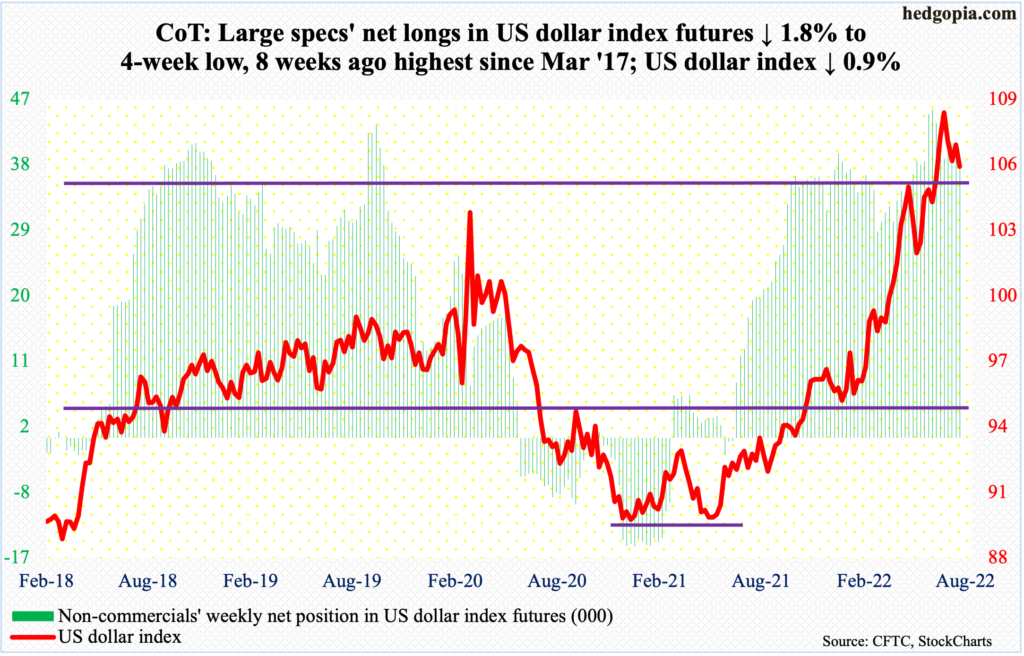
July formed a massive shooting star on the monthly. With August mid-way through, a spinning top has formed; should this stick through the second half of the month, this will be another candle raising the possibility of a significant top in the US dollar index.
The index ticked 109.14 on July 14 before reversing. In January last year, it bottomed at 89.17.
A loss of 104 will be a major negative for dollar bulls. On both Thursday and Friday, this was just about tested as the index tagged 104.52 intraday. Bids showed up there, with the week ending at 105.51.
As things stand, it is a tug of war between the daily and weekly, with the former getting oversold and the latter overbought.
VIX: Currently net short 98.2k, down 643.
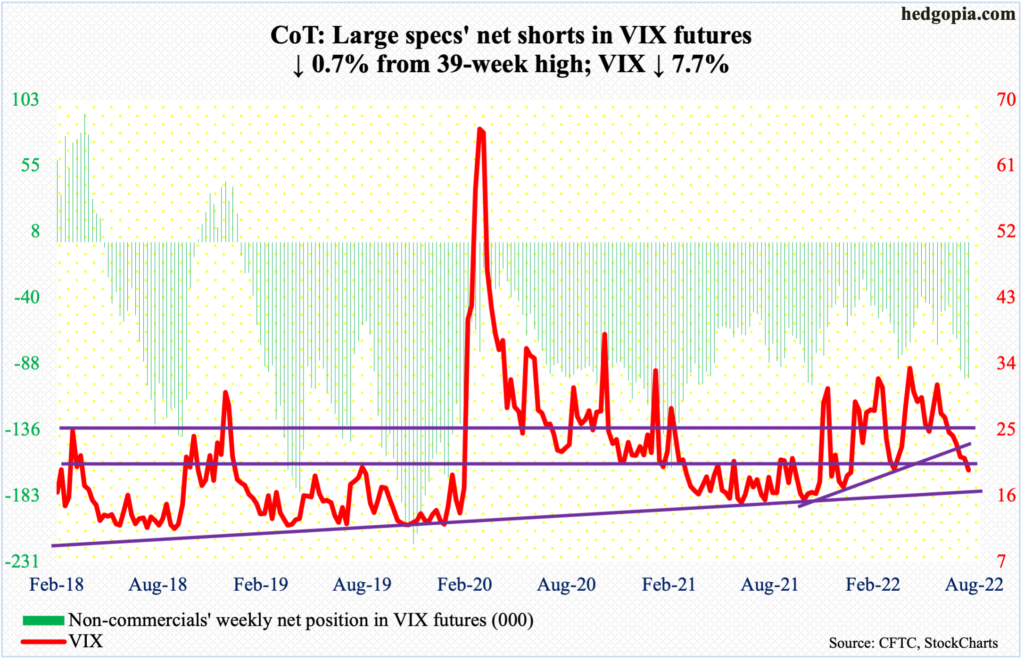
For the first time in nearly four months, VIX broke 20, closing last week at 19.53. The volatility index has now declined for eight weeks in a row.
Last week, it lost both low-20s horizontal support and a rising trend line from last November (using intraday lows) when it bottomed at 14.73. In the right circumstances for equity bulls, volatility bears could now be eyeing sub-17, which is where a rising trend line from November 2017 when VIX made an all-time low of 8.56 lies.
Thanks for reading!
More By This Author:
Russell 2000’s Mini-Breakout Needs Confirmation From S&P 500 And Nasdaq 100
CoT: Looking At The Future Thru The Recent Past
Looking Into The Future Through Futures, What Hedge Funds Buy


Comments
Log in or sign up to join the conversation.