
CoT: Looking At The Future Thru The Recent Past
Following futures positions of non-commercials are as of August 2, 2022.
10-year note: Currently net short 295.5k, up 95.6k.
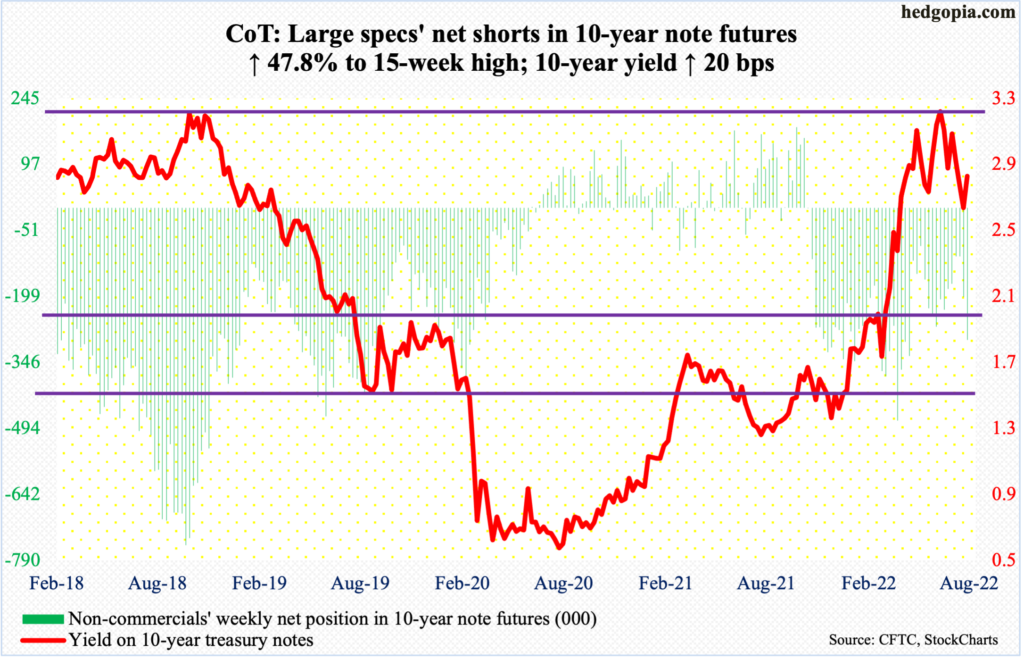
No sooner did the 10-year treasury yield breach low-2.70s than it was reclaimed. This support goes back to April. Ordinarily, once a breach like this occurs, a follow-through follows.
As a matter of fact, rates did tag 2.53 percent intraday Tuesday, pushing the daily into oversold territory. There was also decent horizontal support at 2.5 percent, which bond bears (on price) used as an opportunity to spring into action. It has paid off so far.
Incidentally, non-commercials’ net shorts in 10-year note futures jumped 48 percent in the week to Tuesday to a 15-week high.
Yields rallied 20 basis points this week, with Friday alone adding 16 basis points in reaction to July’s much-better-than-expected payrolls report showing the economy added 528,000 non-farm jobs. Bond bears face an important test ahead.
At 2.9 percent lies a falling trend line from June 14 when the 10-year peaked at 3.48 percent, which was the highest since April 2011. June produced a massive reversal candle. So, despite this week’s oversold gains, that high has the potential to register as a major high. The trend-line resistance in question – or the 50-day moving average at 2.97 percent – could see the bulls try to put their foot down in the sessions ahead.
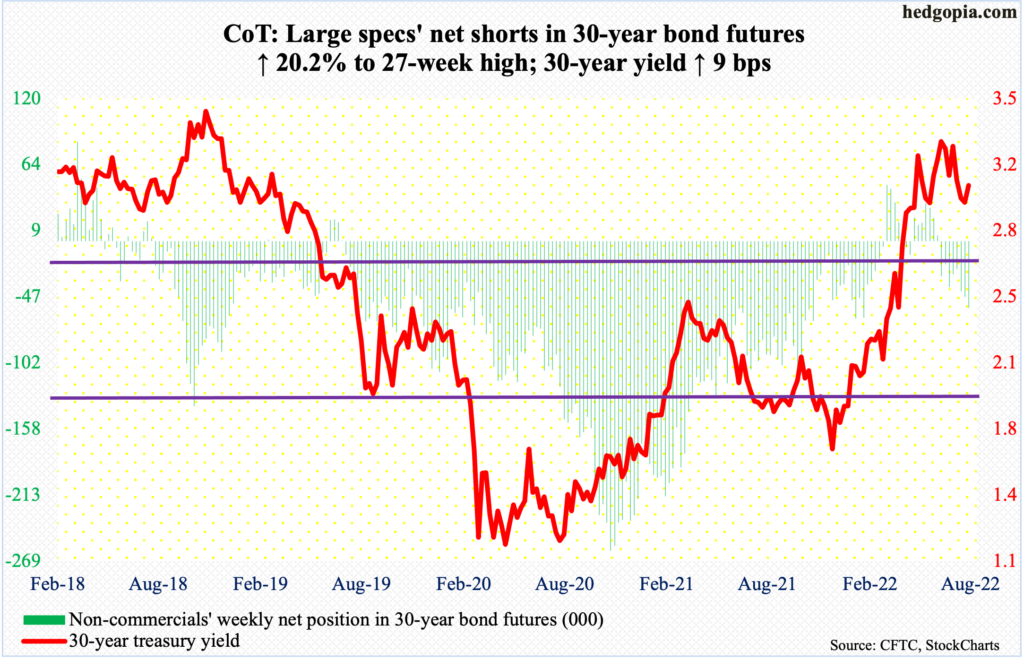
30-year bond: Currently net short 56.1k, up 9.4k.
Major economic releases for next week are as follows.
The NFIB optimism index (July) and labor productivity (2Q22) are scheduled for Tuesday.
Small-business optimism dropped 3.6 points month-over-month in June to 89.5 – the lowest since January 2013.
Non-farm output per hour dropped 0.6 percent from a year ago in 1Q22. This was the second quarterly drop year-over-year in the last three quarters. The last time productivity shrank was in 2Q16.
Wednesday has the consumer price index (July) on dock. In the 12 months to June, headline and core CPI rose 9.1 percent and 5.9 percent respectively, with the former highest since November 1981 and the latter having peaked at 6.5 percent in March (this year), which was the highest print since August 1982.
The producer price index (July) comes out on Thursday. June wholesale prices, on a headline and core basis, surged 11.3 percent and 6.4 percent y/y.
The University of Michigan’s consumer price index (August, preliminary) will be reported on Friday. Consumer sentiment in July increased 1.5 points m/m to 51.5. June’s 50 was an all-time low (data goes back to January 1978).
WTI crude oil: Currently net long 253k, down 3.9k.
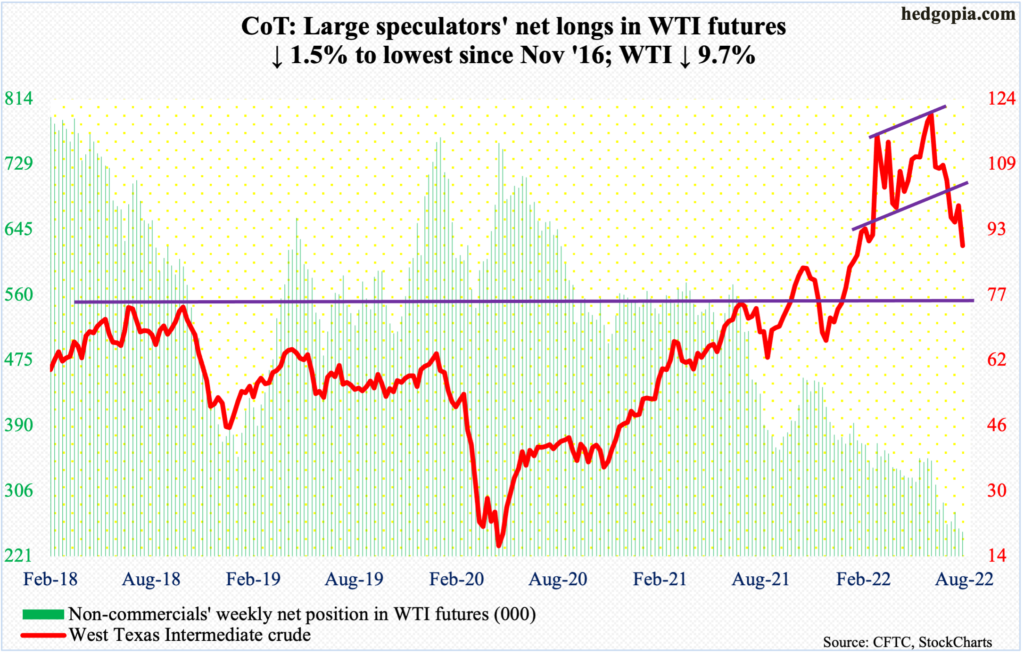
Oil bulls could no longer hold $93-$94. Support at this level goes back to at least February this year. After several successful tests since mid-July, this decisively gave way on Wednesday. The 200-day, too, was breached this week.
The next level to watch is $85. WTI dropped as low as $87.01 intraday Friday, closing out the week at $89.01/barrel, down 9.7 percent.
In the meantime, per the EIA, US crude production in the week to July 29 was unchanged at 12.1 million barrels per day. Crude imports increased 1.2 mb/d to 7.3 mb/d. As did stocks of crude and gasoline, which respectively rose 4.5 million barrels and 163,000 barrels to 426.6 million barrels and 225.3 million barrels. Distillate inventory, on the other hand, decreased 2.4 million barrels to 109.3 million barrels. Refinery utilization dropped 1.2 percentage points to 91 percent.
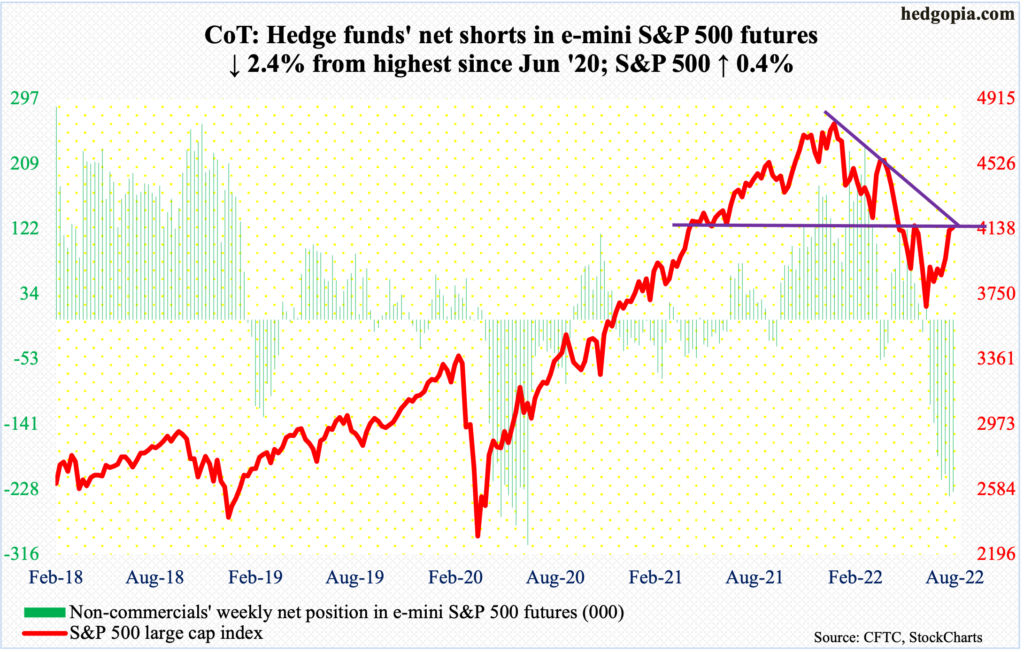
E-mini S&P 500: Currently net short 231.9k, down 5.8k.
Fund flows went back to being a drag for US equities. In the week to Wednesday, US-based equity funds lost $7.5 billion (courtesy of Lipper) and SPY (SPDR S&P 500 ETF), VOO (Vanguard S&P 500 ETF) and IVV (iShares Core S&P 500 ETF) $2.4 billion (courtesy of ETF.com). In the prior week, for the first time in seven weeks, flows into equity funds turned positive, taking in $372 million, even as the three ETFs attracted $5.2 billion.
Bulls, probably eyeing the massive net shorts in S&P 500 e-mini futures, tried to build on last week’s 4.3-percent jump in the cash (4145) but were held up by dual resistance. Up 0.4 percent for the week, the index faces horizontal and trend-line resistance at 4150s. The S&P 500 essentially went sideways around this level in the last several sessions. A push through this roadblock can entice more buying. In the best of circumstances for the bulls, trend-line resistance from January’s record high 4819 lies at 4300.
Else, near-term, the daily is getting way extended.
Euro: Currently net short 38.8k, down 2.8k.
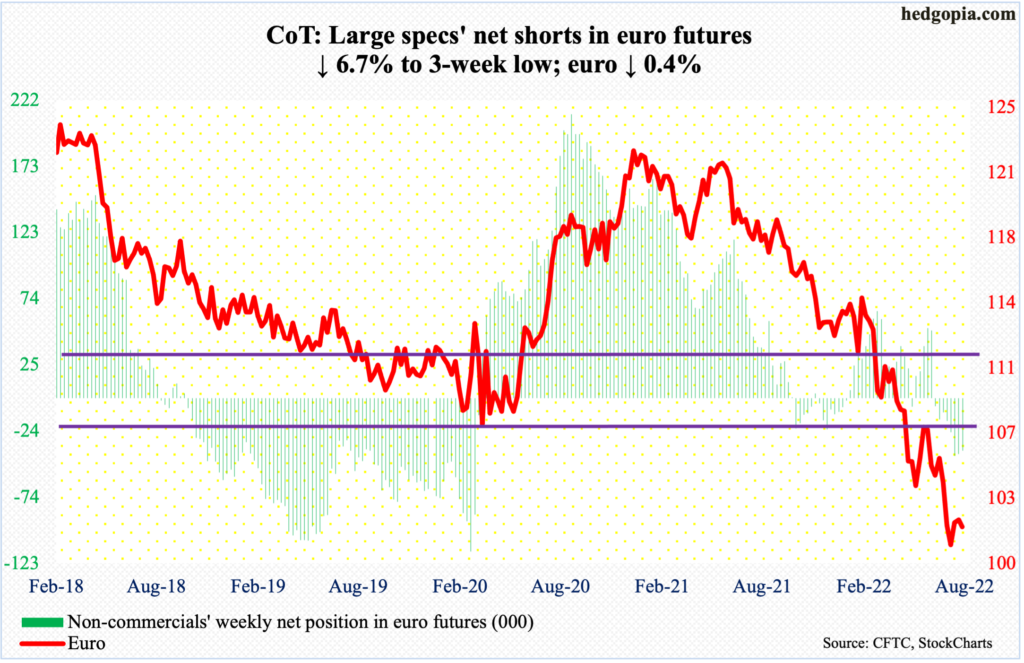
The euro ($1.0182) continued to go sideways around $1.0250s. This follows a July 14 bottom at $0.9952, with the prior session tagging $0.9998. Earlier, the currency peaked at $1.2345 in January last year.
The first step toward sustained recovery will have occurred once euro bulls reclaim $1.0350s, which would also have filled a July 5 gap. After this lies crucial $1.04-$1.05, which, once recaptured, could mark a shift in trend.
Gold: Currently net long 124.3k, up 31.6k.
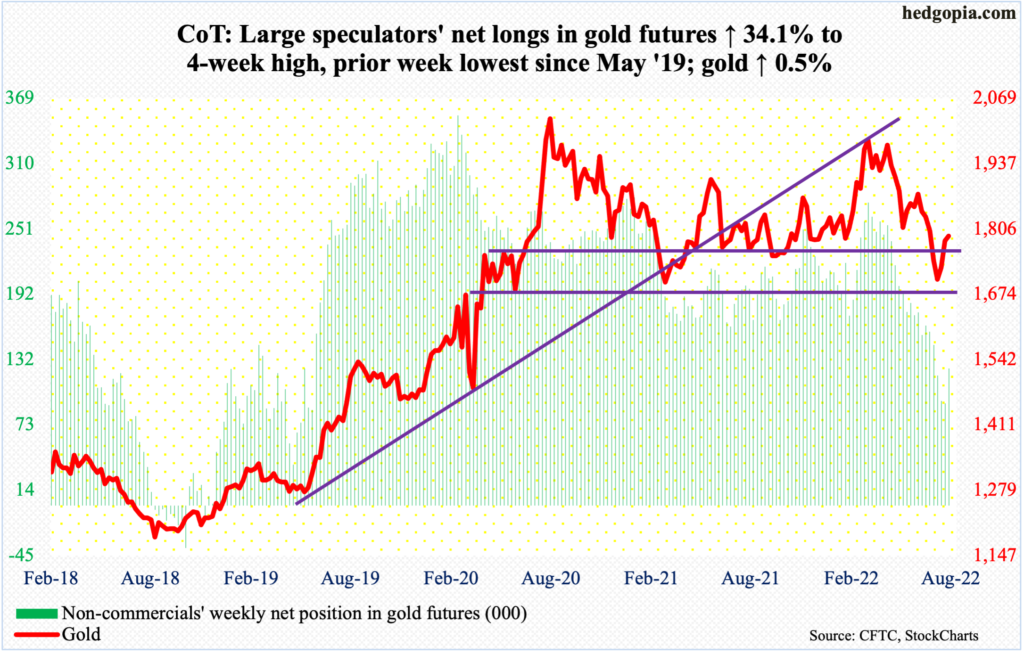
July was down a tad but also produced a massive hammer reversal; on the 21st, horizontal support at $1,670s was successfully tested. Then, late last week, $1,760s-$1,770s was reclaimed; this week, the support was tested in nearly all sessions – successfully.
Incidentally, after five consecutive weekly drops, non-commercials in the week to Tuesday added to their net longs in gold futures, with the prior week the lowest since May 2019.
This week, the metal ($1,791/ounce) rallied 0.5 percent but also left a rather long upper wick on the weekly candle, facing resistance just north of $1,800.
The daily is getting overbought. A test of $1,760s-$1,770s looks imminent, with a slight edge to the bears.
Nasdaq 100 index (mini): Currently net long 24.7k, down 7.1k.
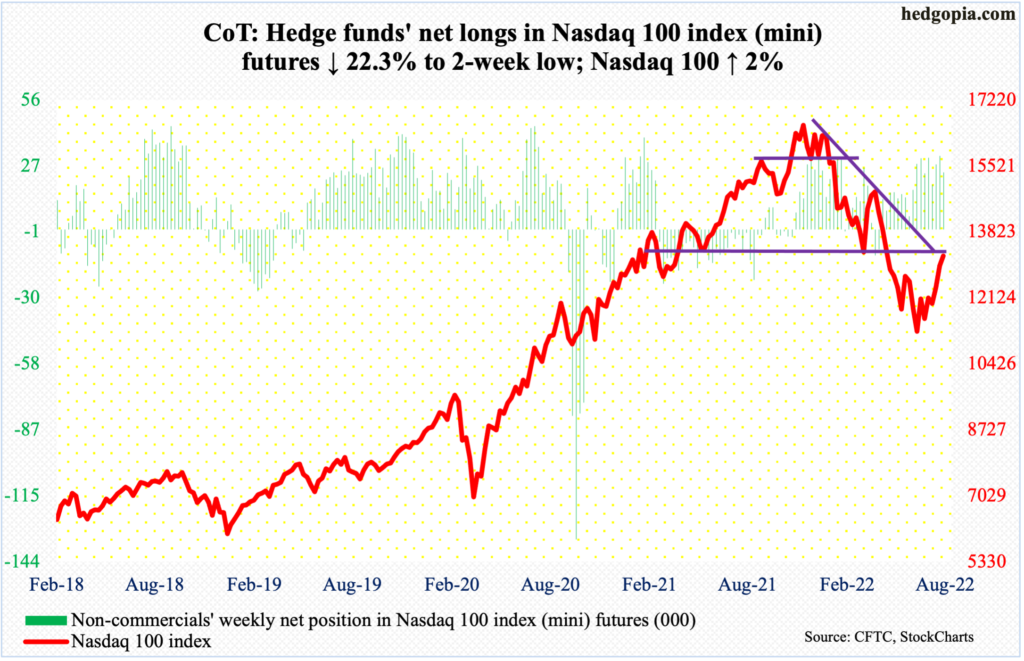
Several monthly indicators just turned up from oversold territory. That is the good news as far as tech bulls are concerned. The not so good is the fact that the Nasdaq 100 currently sits overbought on the daily and is running against crucial resistance.
The tech-heavy index (13208) rallied a couple of percent this week – its third straight up week and fifth in the last seven. Earlier, it plunged 34.2 percent between last November’s record high 16765 and the June 16 low of 11037.
This week, straight-line resistance at 13000 was taken care of, which is tantamount to a battle won. The war lies ahead, which comprises trend-line resistance from last November’s – or December’s – highs. Thursday’s intraday high of 13327 just about tested this – unsuccessfully. This hurdle is unlikely to yield right away. The daily is extended.
Russell 2000 mini-index: Currently net short 120k, up 14.7k.
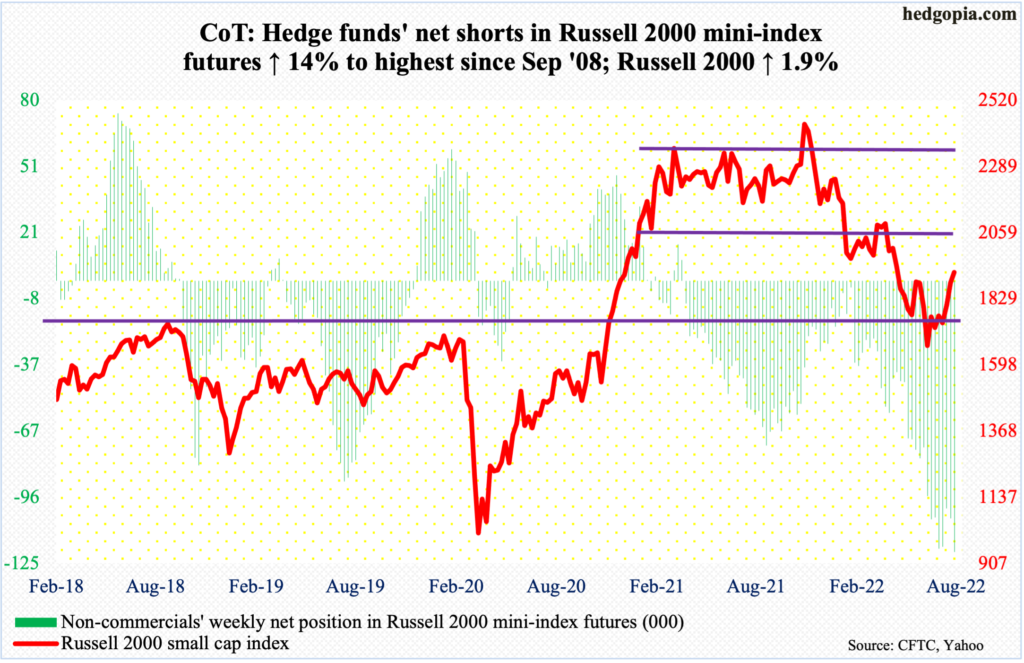
Last week’s 4.3-percent rally in the Russell 2000 did not deter non-commercials from amassing most net shorts in mini-index futures since September 2008 (holdings are as of this Tuesday). In the right circumstances for small-cap bulls, these shorts can act as a tailwind for the cash as short-covering unfolds.
Bulls did manage some important technical wins. Last week, they rallied the Russell 2000 through a declining trend line from last November when the index peaked at 2459. This week, 1900 was won, closing the week at 1922.
Earlier, a major breakdown occurred mid-January, losing 2080s; for 10 months, the Russell 2000 went back and forth between 2080s and 2350s. It then seesawed between 2080s and 1900, followed by a ping pong match between 1900 and 1700; 1700 is where it broke out of in November 2020. The breakout retest has been successful, which led to the reclaiming this week of 1900. If the action the past couple of weeks is genuine, bulls will be eyeing 2080s in due course. For now, a pause is the path of least resistance.
US Dollar Index: Currently net long 39.3k, down 1.2k.
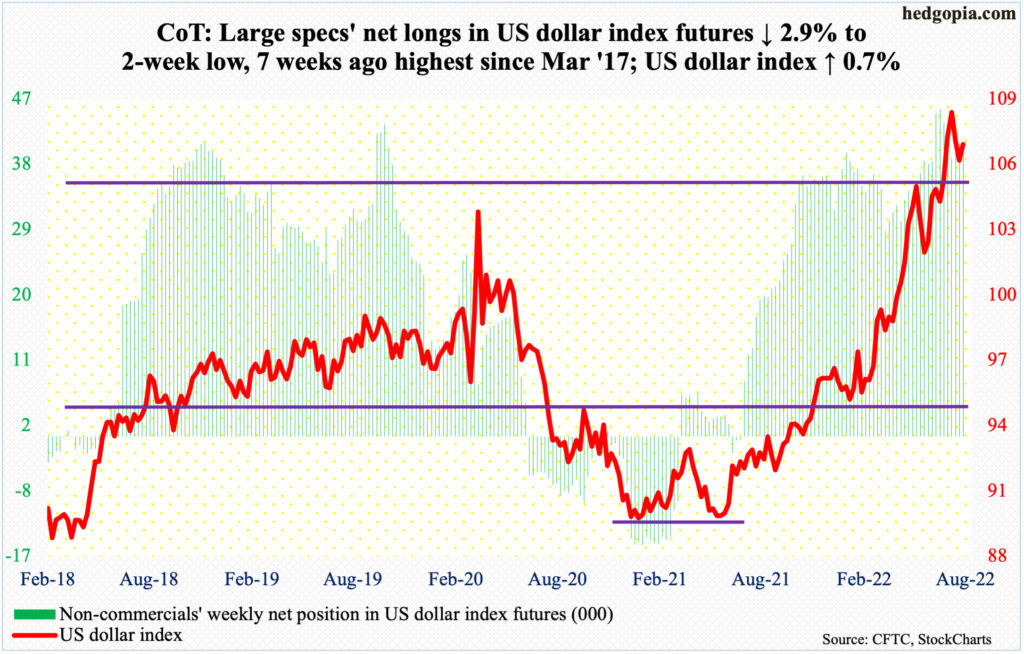
July formed a massive shooting star on the monthly; on the 14th, the US dollar index ticked 109.14 before reversing. In January last year, it bottomed at 89.17.
This week, the 50-day was just about tested, with the index (106.49) tagging 104.92 intraday Tuesday. This can be viewed as a successful breakout retest, as the index broke out of 105 a month ago, and out of 104 before that in June, with the latter acting as a ceiling going back to January 2017.
This gives dollar bulls an opportunity to unwind the daily oversold condition, but, longer-term, last month’s high could prove to be important.
A loss of 104 will be a major negative for the bulls.
VIX: Currently net short 98.8k, up 6.3k.
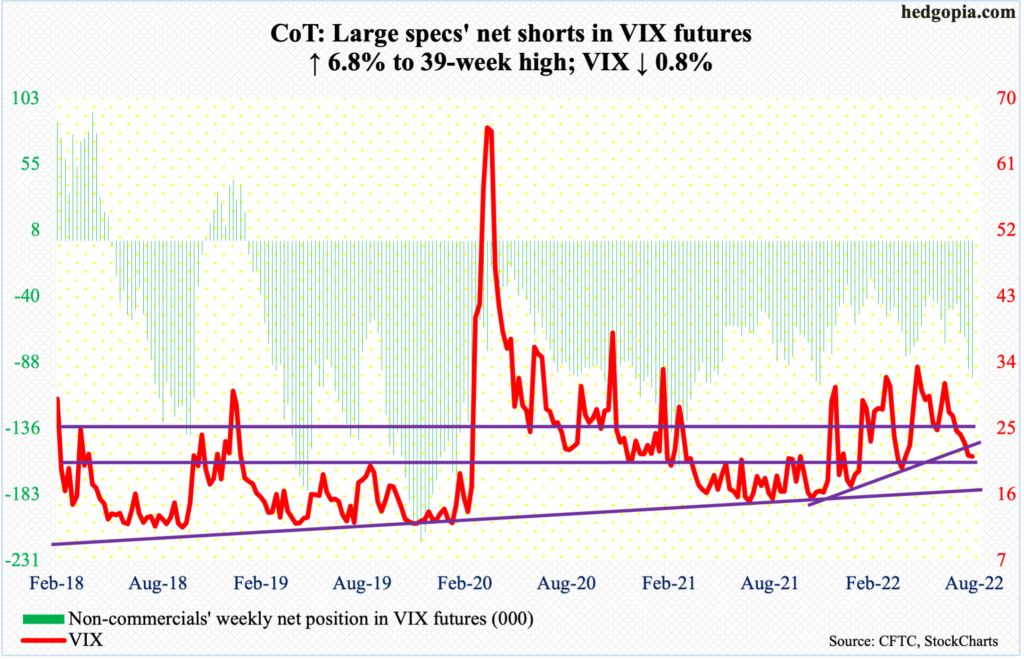
On Tuesday, VIX reclaimed the 200-day but only intraday. In the last 13 sessions, it closed above the average only once. By Friday, the volatility index touched 20.76 intraday, to close at 21.15.
VIX is clinging on to crucial support – low-20s horizontal and a rising trend line from last November (using intraday lows) when it bottomed at 14.73. Next week is key, if this floor cracks, then volatility bears – or, equity bulls – could be eyeing 17, which represents a rising trend line from November 2017 when VIX made an all-time low of 8.56.
Near-term, the daily could be itching to rally.
More By This Author:
Looking Into The Future Through Futures, What Hedge Funds Buy
Big Week For Tech Earnings; Ahead Of This, Nasdaq 100 Acts Strong, With Weakness Brewing Friday
CoT Report - Peeking At Futures, Big Buys


