
With the industrial production release today (+0.8% vs. +0.2% m/m consensus), we have the following picture of key series followed by the NBER’s BCDC:
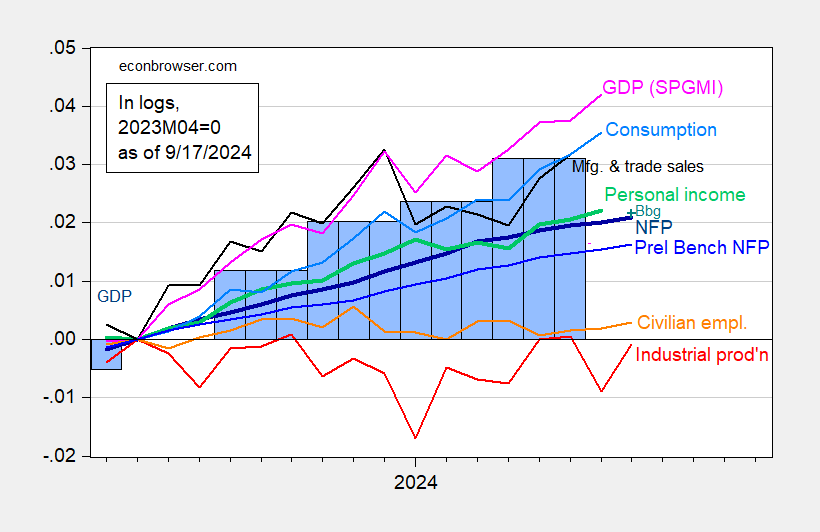
Figure 1: Nonfarm Payroll (NFP) employment from CES (bold dark blue), Bloomberg consensus of 9/6 for NFP (blue +), implied NFP from preliminary benchmark (blue), civilian employment (orange), industrial production (red), personal income excluding current transfers in Ch.2017$ (bold green), manufacturing and trade sales in Ch.2017$ (black), consumption in Ch.2017$ (light blue), and monthly GDP in Ch.2017$ (pink), GDP (blue bars), all log normalized to 2023M04=0. Source: BLS via FRED, Federal Reserve, BEA 2024Q2 2nd release, S&P Global Market Insights (nee Macroeconomic Advisers, IHS Markit) (9/3/2024 release), and author’s calculations.
Note that the incorporation of the preliminary benchmark (which might overstate the eventual NFP downshift — see here) still shows continued growth through 2024M08.
Some alternative indicators — coincident index for monthly GDP, Philadelphia Fed’s early benchmark for official (pre-benchmarked) NFP, manufacturing production for industrial production, retail sales for manufacturing and trade industry sales — in Figure 2. Retail sales +0.1% vs. -0.2% m/m consensus).
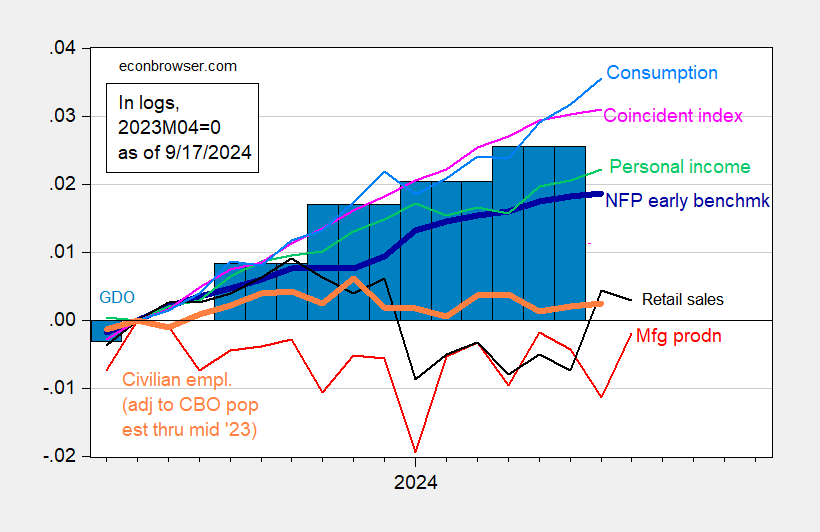
Figure 2: Nonfarm Payroll early benchmark (NFP) (bold blue), civilian employment adjusted using CBO immigration estimates through mid-2023 (orange), manufacturing production (red), personal income excluding current transfers in Ch.2017$ (light green), retail sales in 1999M12$ (black), consumption in Ch.2017$ (light blue), and coincident index (pink), GDO (blue bars), all log normalized to 2023M04=0. Early benchmark is official NFP adjusted by ratio of early benchmark sum-of-states to CES sum of states. Source: Philadelphia Fed, Federal Reserve via FRED, BEA 2024Q2 second release, and author’s calculations.
None of the indicators seem to show a downturn in August, although production — and more recently retail sales — have shown some sideways-trending. However, we still need to see personal income ex-transfers (a key indicator followed by the NBER’s BCDC) and consumption for August.
GDPNow as of today is 2.5% q/q AR for Q3. Goldman Sachs has upped its tracking estimate to 2.8%.
More By This Author:
When Tariffs Last Bloomed – Soybean Edition
Manufacturing: When Tariffs Last Bloomed
Real Average Wages


Comments
Log in or sign up to join the conversation.