
Following a few months of downward trending initial jobless claims bringing the indicator back down around multi-decade lows, there has finally been a significant uptick. Whereas last week’s reading was revised lower to an even more impressive 190K (the lowest since April), the latest print soared from 29K to 219K. That is only the highest level since the end of August, but it also is back in the range of pre-pandemic readings while also marking the largest week-over-week increase in claims since the first week of June.

On a non-seasonally adjusted basis, claims rose as might have been expected for the current week of the year. As shown in the second chart below, as far as consistency of week-over-week increases go, the current week of the year is tied with the 2nd and 45th (approximately the weeks of January 8th and November 5th) for fourth as claims have risen 85.5% of the time since 1967. Additionally, before seasonal adjustment, it was not a particularly large increase as the 13.3K WoW rise was half of the average for the comparable week of the year. Even after that increase, unadjusted claims have only been lower during the year’s comparable week twice: 1968 and 1969. In other words, a drift higher in claims is normal at this point of the year, and even with that move higher, claims remain nothing short of impressive.

As for continuing claims which are lagged an additional week to the initial claims number, the latest week saw a modest increase of 15K to 1.361 million. That snapped a streak of four consecutive weeks of declines. Whereas seasonally adjusted initial claims have risen back into the pre-pandemic range, continuing claims have only experienced a modest move higher and are well below their own levels from pre-pandemic years.

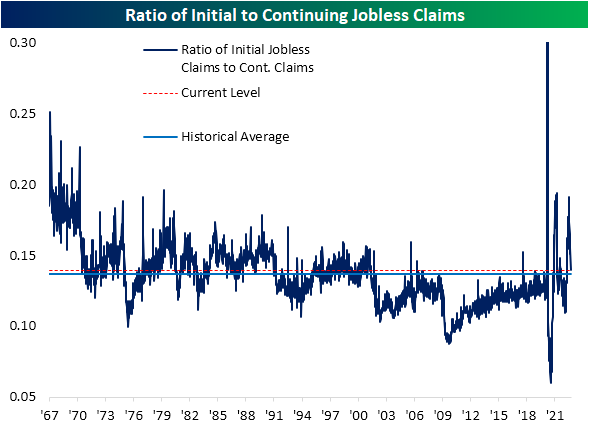
In the past few months, we have consistently checked in on the ratio of initial jobless claims to continuing claims (both seasonally adjusted) as a measure of the lack of follow-through of the former to the latter. With last week’s very strong initial claims number that was more reflective of the still strong continuing claims number, that ratio has now come back in line with the historical average.
More By This Author:
Oil And Stocks Mix It UpA Five Times In A Lifetime Moment
ETF Total Returns Across Asset Classes


Comments
Log in or sign up to join the conversation.