
Like oil and water, oil and stock prices generally don’t mix. A big jump in oil prices usually leads to lower stock prices, while stock prices often experience a boost when oil prices decline. That’s what makes the performance of both to start the week so interesting with the S&P 500 up over 5% week to date through Tuesday’s close while oil prices surged nearly 9% during that same span.
In the case of oil prices, two-day rallies of the magnitude we saw through Tuesday’s close have been common going back to the start of 1984 which is as far back as we have full-year data on a daily basis. You could even say that moves of this magnitude have been relatively common.

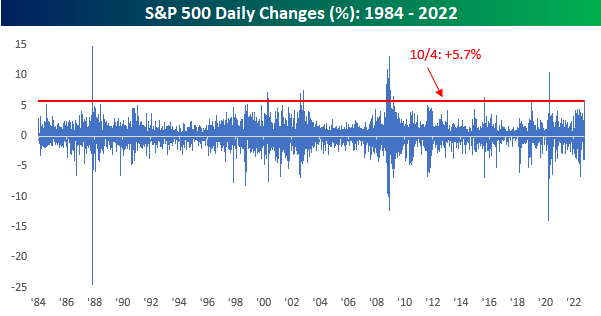
Two-day rallies in equity prices of the magnitude seen this week haven’t been nearly as common, but we wouldn’t call them rare either. Besides this week, there have been 23 other times since 1984 when the trailing two-day performance of the S&P 500 was greater than this week’s two-day rally.
Where things really start to get much less common is when both the S&P 500 and crude oil prices rally 5% or more at the same time. That has only happened six other times since 1984, and prior to 2008, it had never happened before. The chart below shows the S&P 500 since 2007 with the red dots showing every day that both the S&P 500 and crude oil rallied 5%+ over a two-day span. Four of those occurrences came during and coming out of the Financial Crisis, another was in August 2015 when China devalued the yuan, and the most recent occurrence before this week was right after the COVID crash lows. With the exception of the first occurrence right after Lehman’s bankruptcy in September 2008, every one of the other occurrences came either in the later stages of a bear market or coming out of a significant decline, and what they all have in common is that they occurred during periods of severe market dislocations.

One aspect of the first occurrence in September 2008 that has bears salivating is that the S&P 500’s pattern leading up to that occurrence looks very similar to the pattern now, and in each case was down by similar amounts from all-time highs (19.2% in September 2008 and 20.7% as of Tuesday’s close). Additionally, in both cases, the bounce came shortly after the S&P 500 broke below a prior low. Looking more closely at the two periods and overlaying them on top of each other, though, besides the fact that the S&P 500 was down sharply in the year leading up to both periods, the patterns don’t look all that similar after all and the correlation between closing prices is just 0.63.

More By This Author:
A Five Times In A Lifetime Moment
ETF Total Returns Across Asset Classes
Optimism No Where To Be Found


Comments
Log in or sign up to join the conversation.