Are High Yield Spreads Forecasting Another Stock Market Decline?
There are a lot of indicators to follow when trying to project future stock market performance.
But today we look at an indicator that has a pretty strong record of signaling when stocks are near a top.
“The facts, Ma’am. Just the facts.” – Joe Friday
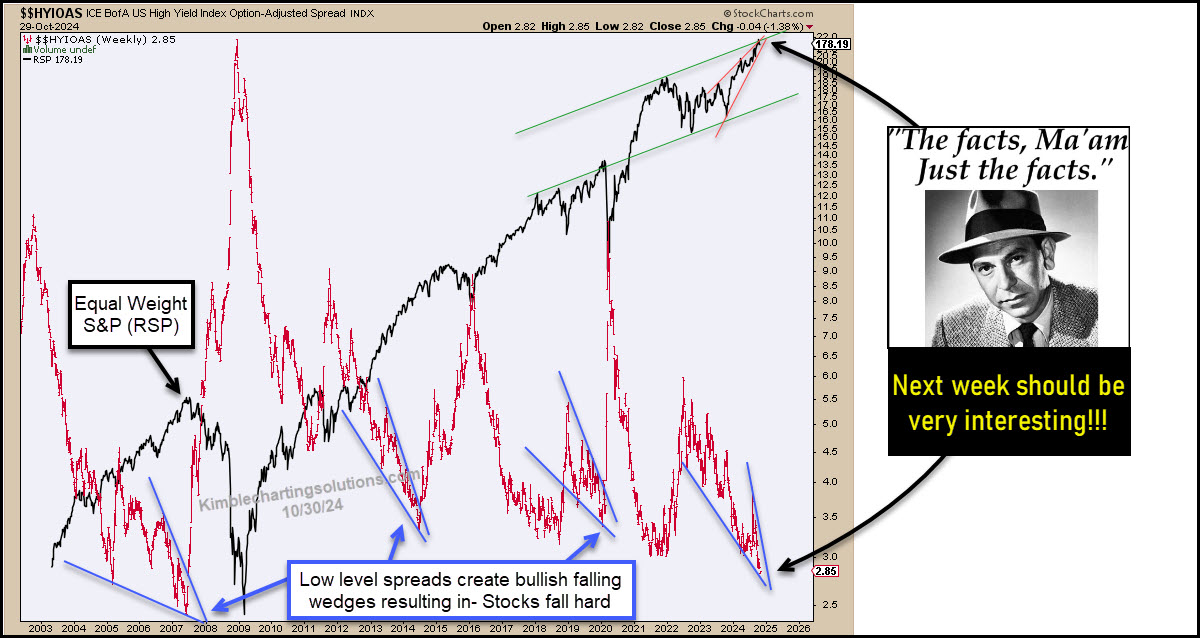
Today we look at a long-term “weekly” chart of the BofA High Yield Option-Adjusted Spreads.
When spreads were low over the past 17 years and formed bullish falling wedges, spreads blew out, and stocks sold off.
Spreads are currently the lowest in 17 years and are forming a bullish falling wedge.
With the elections next week, these patterns could lead to some very interesting price action.
(Click on image to enlarge)

More By This Author:
Will Bearish Pattern Take Semiconductors (And The Stock Market) Lower?Dow Jones Utilities Rally Testing 2022 Highs, Cool Off Level Again?
S&P 500 Bearish Divergence With Junk Bonds Largest Of Year
Disclosure: Sign up for Chris's Kimble Charting Solutions' email alerts--click here.


