
Will Bearish Pattern Take Semiconductors (And The Stock Market) Lower?

Image Source: Unsplash
Over the course of the 15 year bull market, investors have seen important pockets of leadership emerge.
And, as we have highlighted several times, leadership has come in large part due to tech stocks and, more specifically, semiconductor stocks.
Today we highlight a pattern that could be pointing to weakness in leadership.
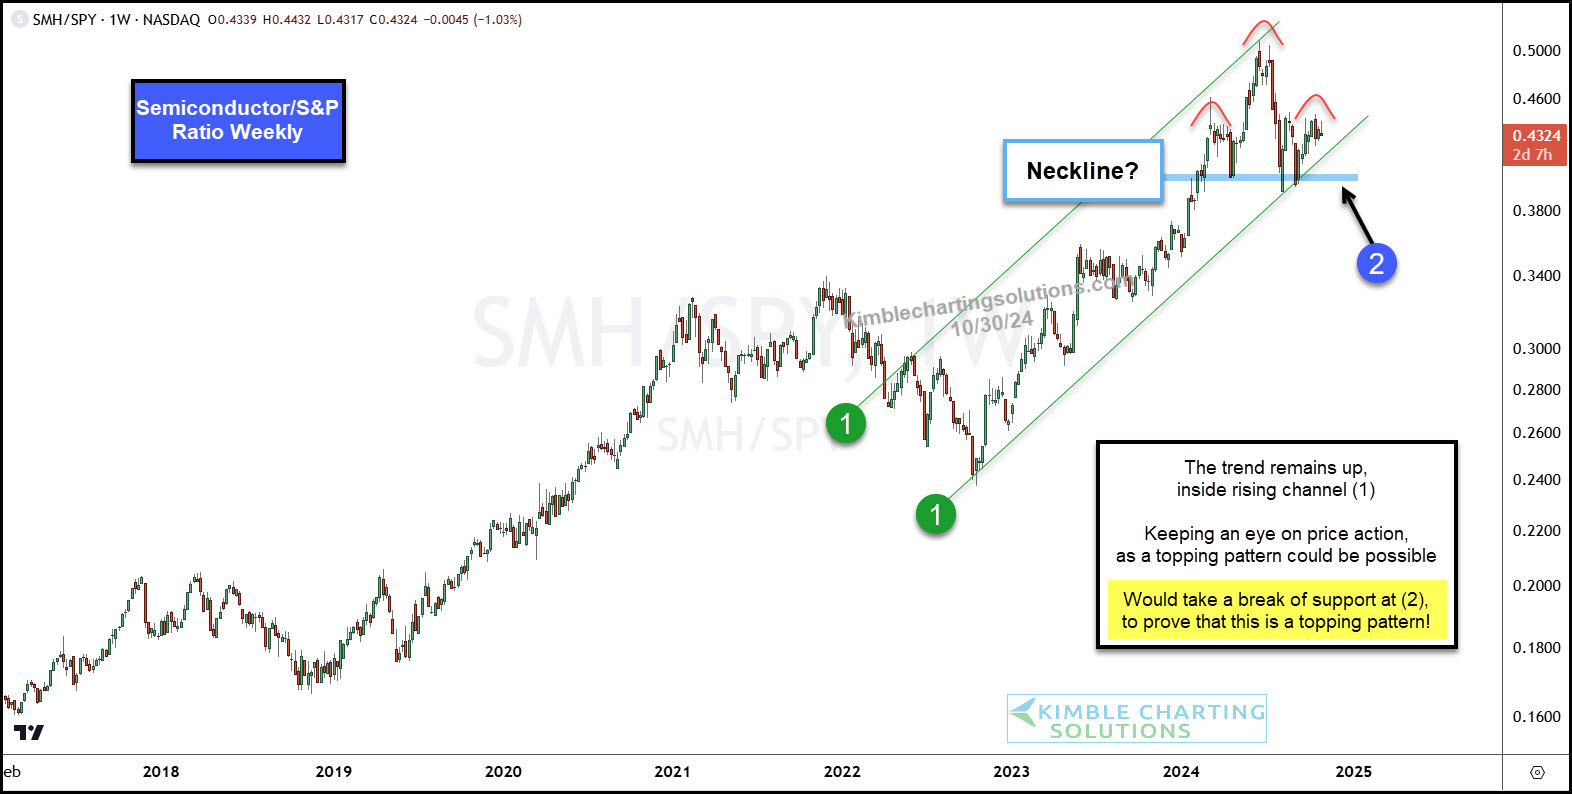
Below is a “weekly” performance ratio chart of the Semiconductors sector ETF (SMH) to the S&P 500 ETF (SPY).
As you can see, the Semiconductors sector (SMH) have shown weakness in 2024. In fact, the ratio peaked on the first day of summer before making a lower high recently.
That weakness, however, has not lead to a wholesale selloff… yet. BUT it this head and shoulders pattern continues to take shape and breaks support at (2), it would suggest that Tech leadership is taking a breather… And a bigger selloff may be afoot.
Seems like an important ratio to watch!
(Click on image to enlarge)
More By This Author:
Dow Jones Utilities Rally Testing 2022 Highs, Cool Off Level Again?
S&P 500 Bearish Divergence With Junk Bonds Largest Of Year
More Treasury Bonds Selling Ahead? Watch The Japanese Yen
Disclosure: Sign up for Chris's Kimble Charting Solutions' email alerts--click here.


