

Image Source: Pixabay
For those who don’t know, here’s the basic breakdown of what I call a 'Chart Party'. One man enters the scene. He leaves. He goes and gets two large cans of Modelo while everyone is asleep. He returns and reenters the arena. He then has to analyze charts until either he’s exhausted or the Modelos are gone.
Let’s get started.
Chart 1: Quantitative Easing Soon? Or Just Rate Cut Madness?
My subject line is pretty simple. Is a 50 basis point cut in the cards this month for the Federal Reserve?
The Fed Funds rate now sits between 4.0% and 4.25% - and there are wild expectations on where markets believe the Fed funds rate will be come next October.
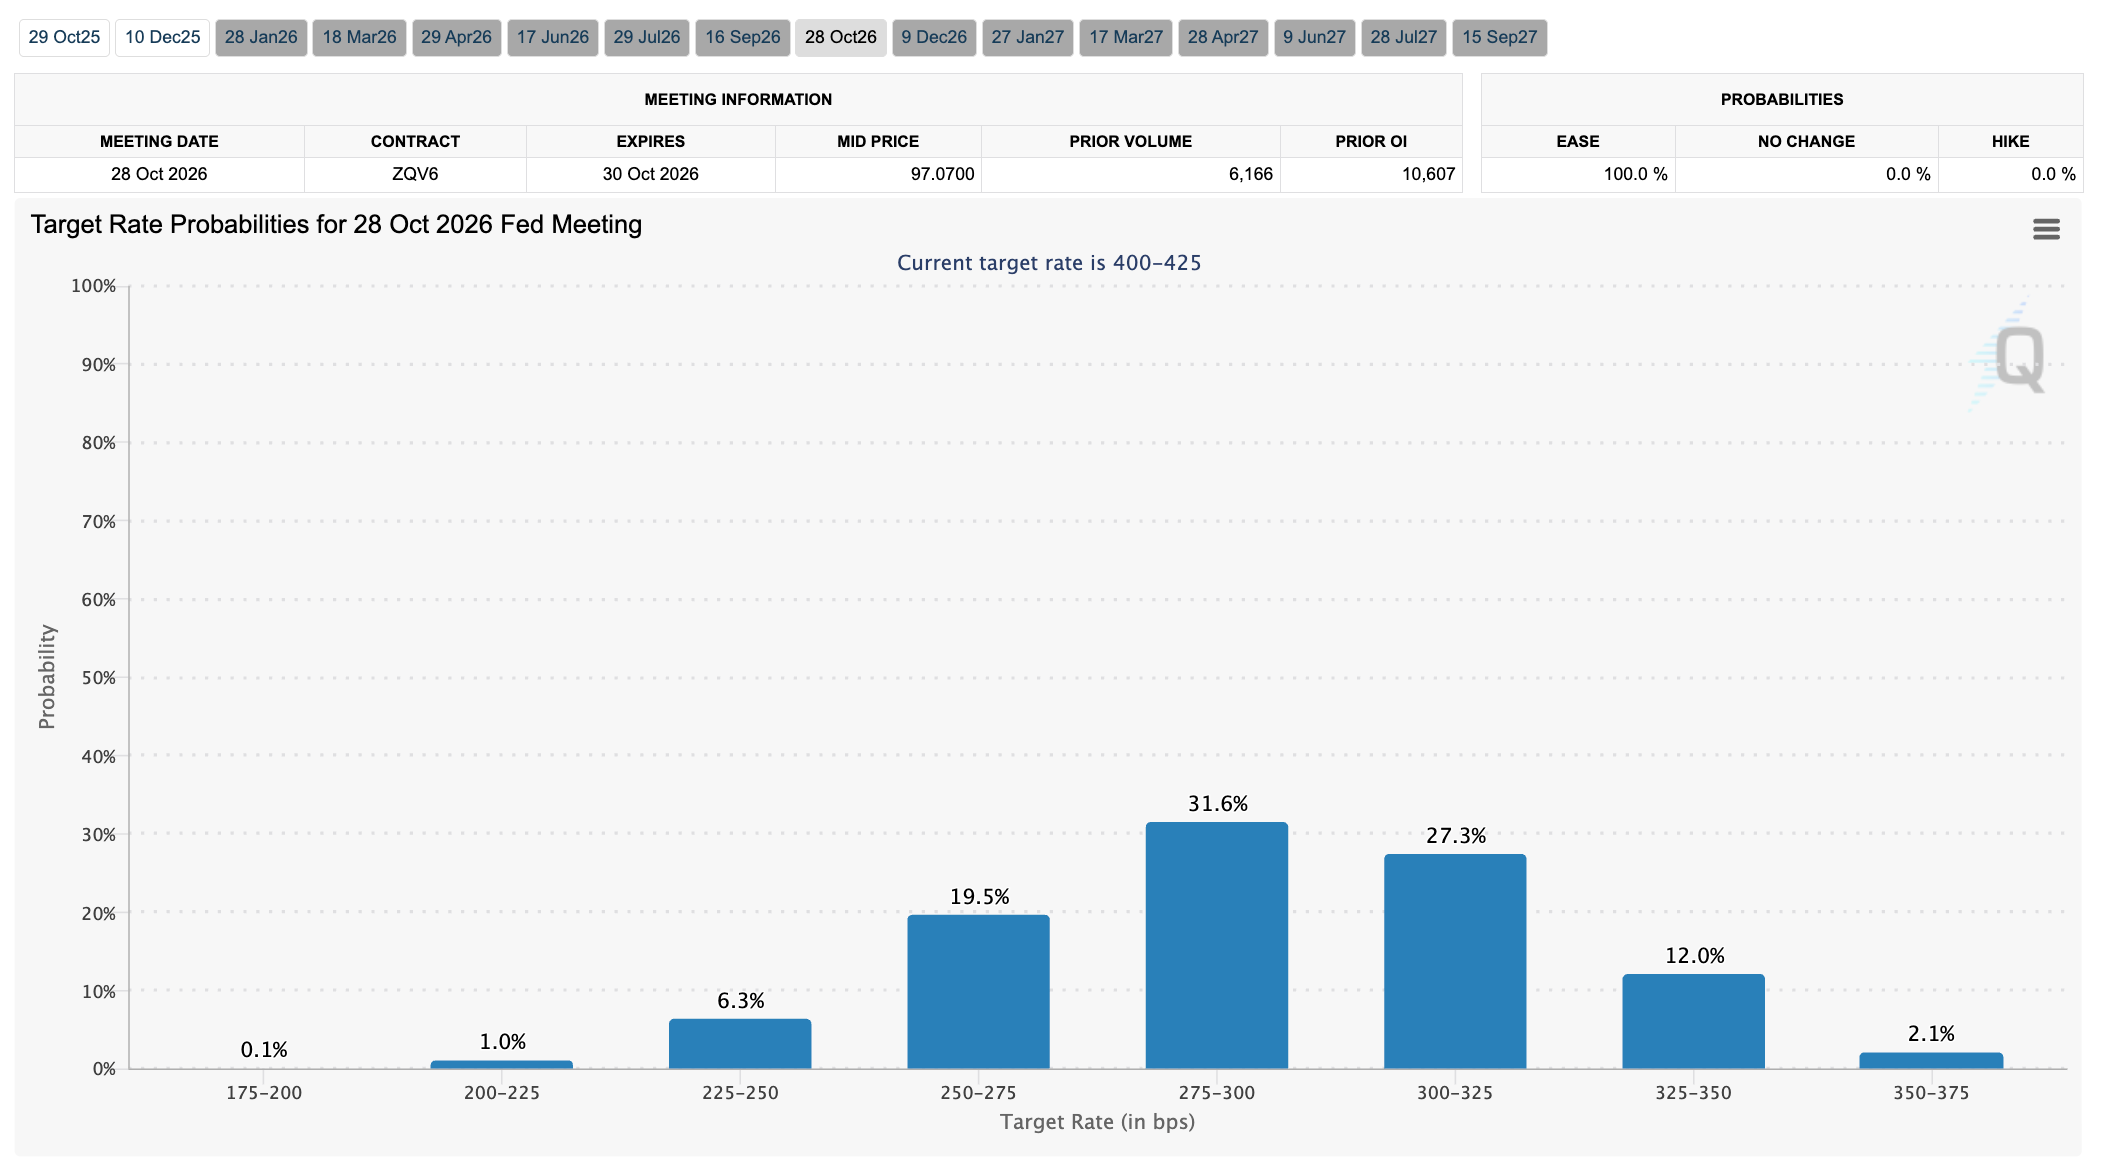
But when it comes to this month, with no clear insight into inflation, new Fed Governor and Trump ally Stephen Miran is pushing for a big cut now and a total of 75 basis points by December (keep in mind one basis point equals 0.01%).
Miran was outvoted 11-1 on a 50-point cut in September. Believe it or not, I think that this week’s problems in the regional banking sector firmly justify the size of the cut. The reality is that we are going to cut by 50 basis points come December.
What does it matter if they do it now or in 45 days? They think that inflation is suddenly going to move up quickly because of an additional 25 basis points? That’s not what is driving inflation. The massive government deficit is. The money printing is. The leverage is.
Cutting 50 points this month would point to the obvious. The Fed is behind the curve - and has been so consistently for so long as I can remember. A 50 point cut would be an admission of defeat. It would become political. It would be a reminder that our jobs data was cartoonishly off for years, and that people are really struggling.
So, they probably won’t do it. But they should. Rip off the Band-Aid. That’s competence. But we don’t have competence.
Regional banks, private credit, and alternatives are taking a bath right now. We’re one more bad, crazy event away from a panic in the overnight lending markets.
As I’ve noted, the Fed Funds rate isn’t what matters in a world of leverage, liquidity, and crowding. The Secured Overnight Financing Rate (SOFR) is, and when it gets detached from the Fed Funds rate, problems start. This chart from Michael Howell showcases that we are in the danger zone:
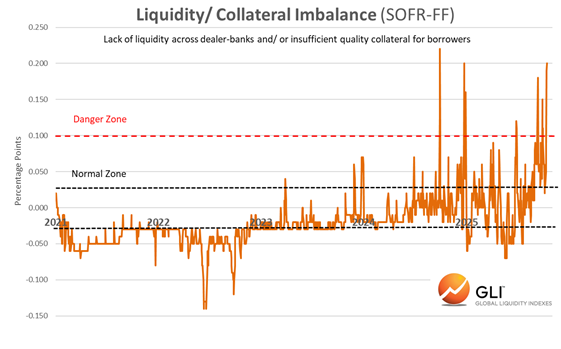
Refinancing risks are a problem. And when we are in the danger zone, that’s when all the banks that have significant exposure to volatility need to reassess their risk management. These problems often lead to a moment like this.
Chart 2: This is Insane
Here’s a chart from Brookings that makes me wish I’d bought more Modelos.
It’s the holdings of the Federal Reserve by maturity. As in, the bonds that the Fed purchases when they mature (effectively when they can roll off the balance sheet).
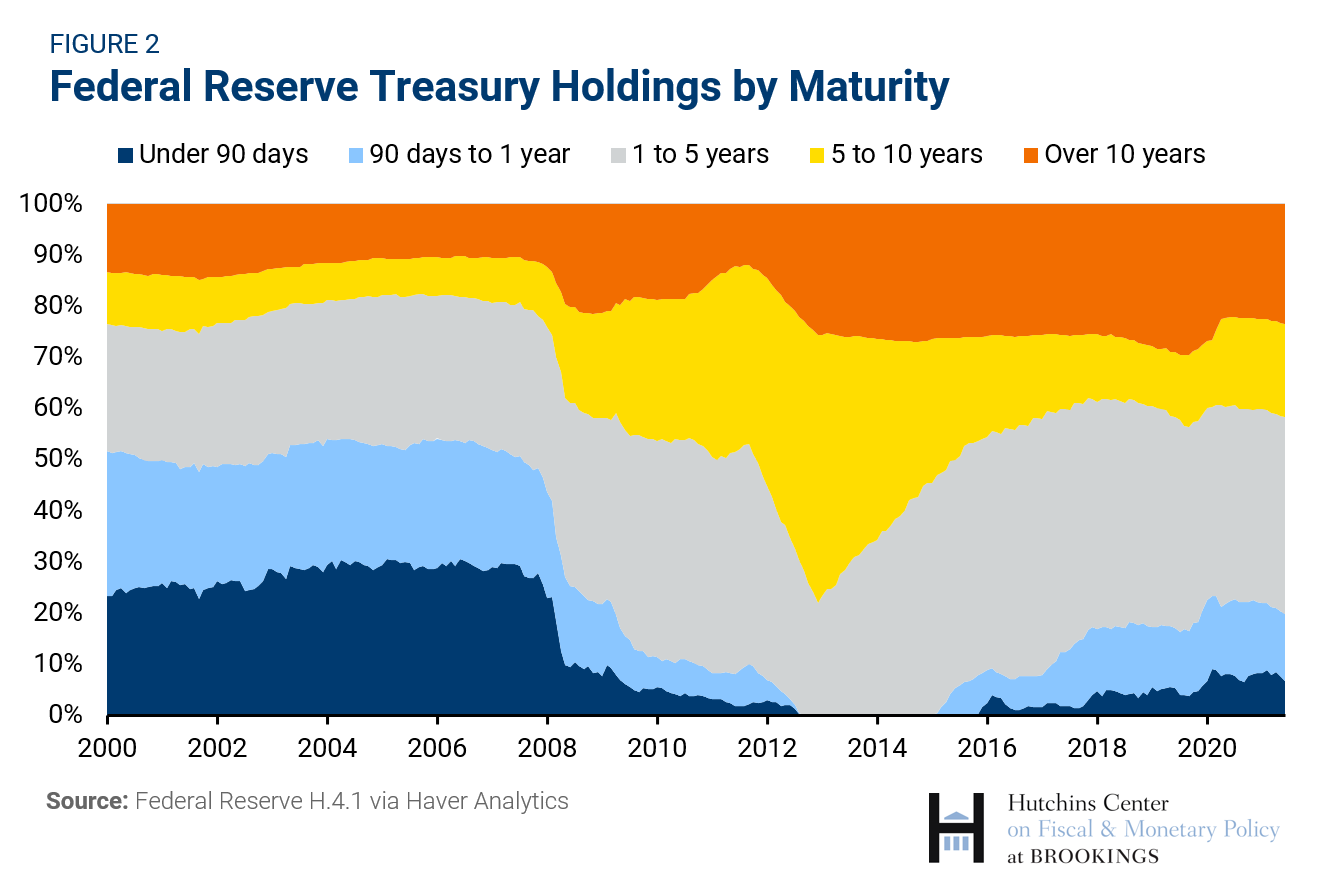
(Click on image to enlarge)
You’ll likely notice that the Fed is holding more long-duration bonds of over 10 years, a clear sign that it’s incredibly hard to get people to own this debt. So, they printed money and then bought long-term bonds out past 10 years. This is money printing.
But what bugs me is the Fed’s ownership of short-duration bonds, everything from under 90 days up to a year. They’re trying to keep the front-end of the yield curve - rates on things under a year - lower. This is 'Fiscal Repression', even though we are still pushing all the stablecoin companies to hold more and more U.S. short-term debt.
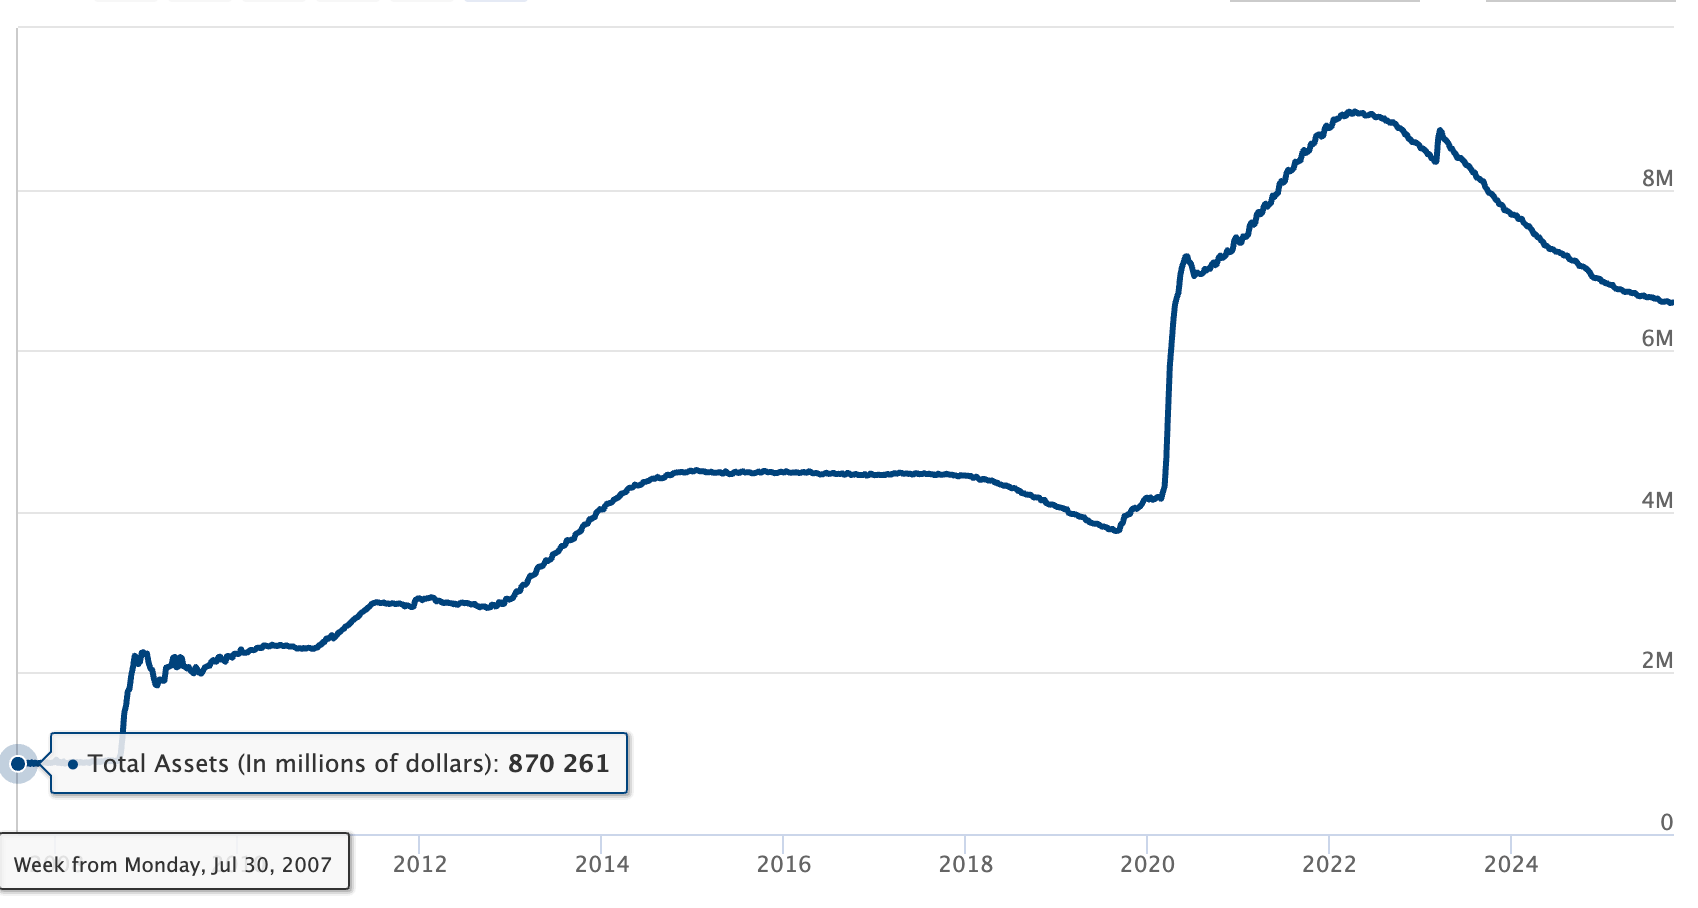
Now, you might look at this chart and say, well, the percentages of these holdings are very different compared to pre-2008. Don’t look at that. The Fed’s balance sheet before 2008 was very limited. They use “millions” in the chart, but these figures are in the trillions.
(Click on image to enlarge)
Today, the Fed Balance sheet is $6.6 trillion, and it’s going to have to rise over the long-term because our debt is unmanageable.
They are working overtime to contain both ends of the yield curve, short duration and long duration. And, as I’ll argue, they’re going to have to do more quantitative easing. I expect that the Fed’s balance sheet will roar to $10 trillion by 2030. The funny thing about it? That’s bullish as hell for equities.
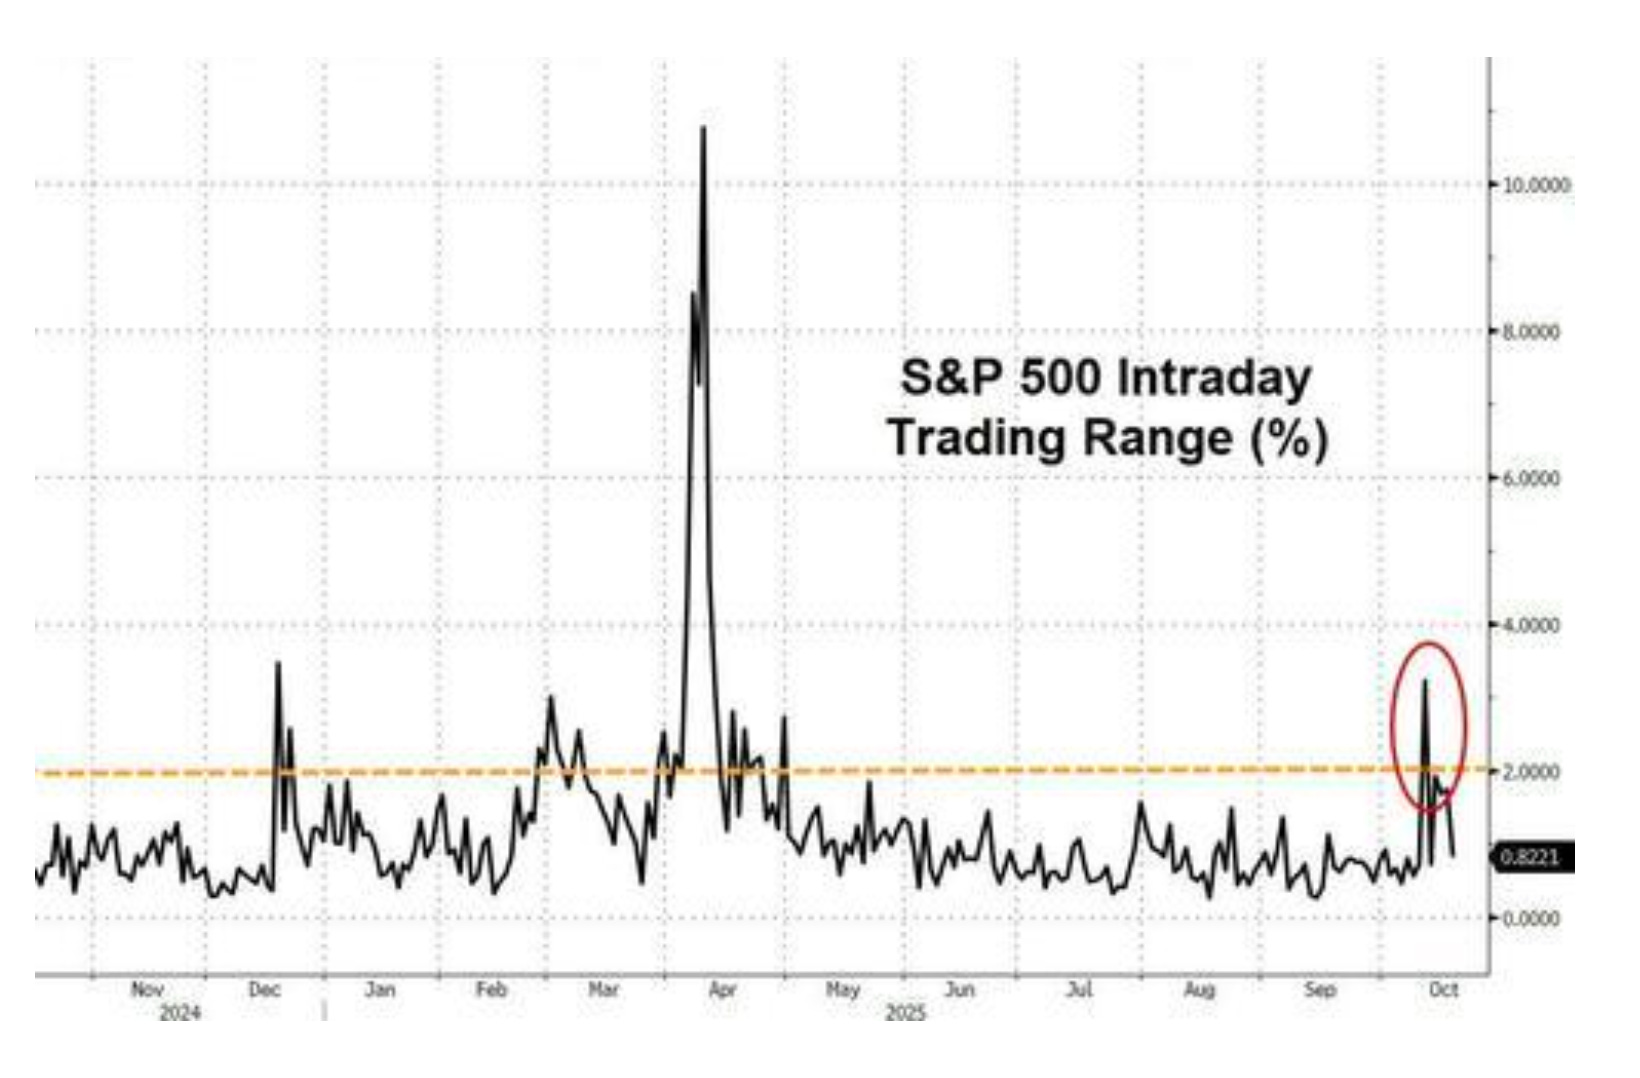
Chart 3: Volatility Awakens
I’ve been worried about the markets for the last couple of weeks. And it’s when our signal turns negative that we start to see these intraday ranges pick up.
We just had our first 2% day since April.
The thing that matters here is that we’ve had more 2% days up and down this year than we had in 2023 and 2024 combined. That’s because of the ever-increasing increase in global liquidity (capital).
Michael Howell and CrossBorder Capital predict that the liquidity cycle will peak next year. And then? Get ready for fireworks.
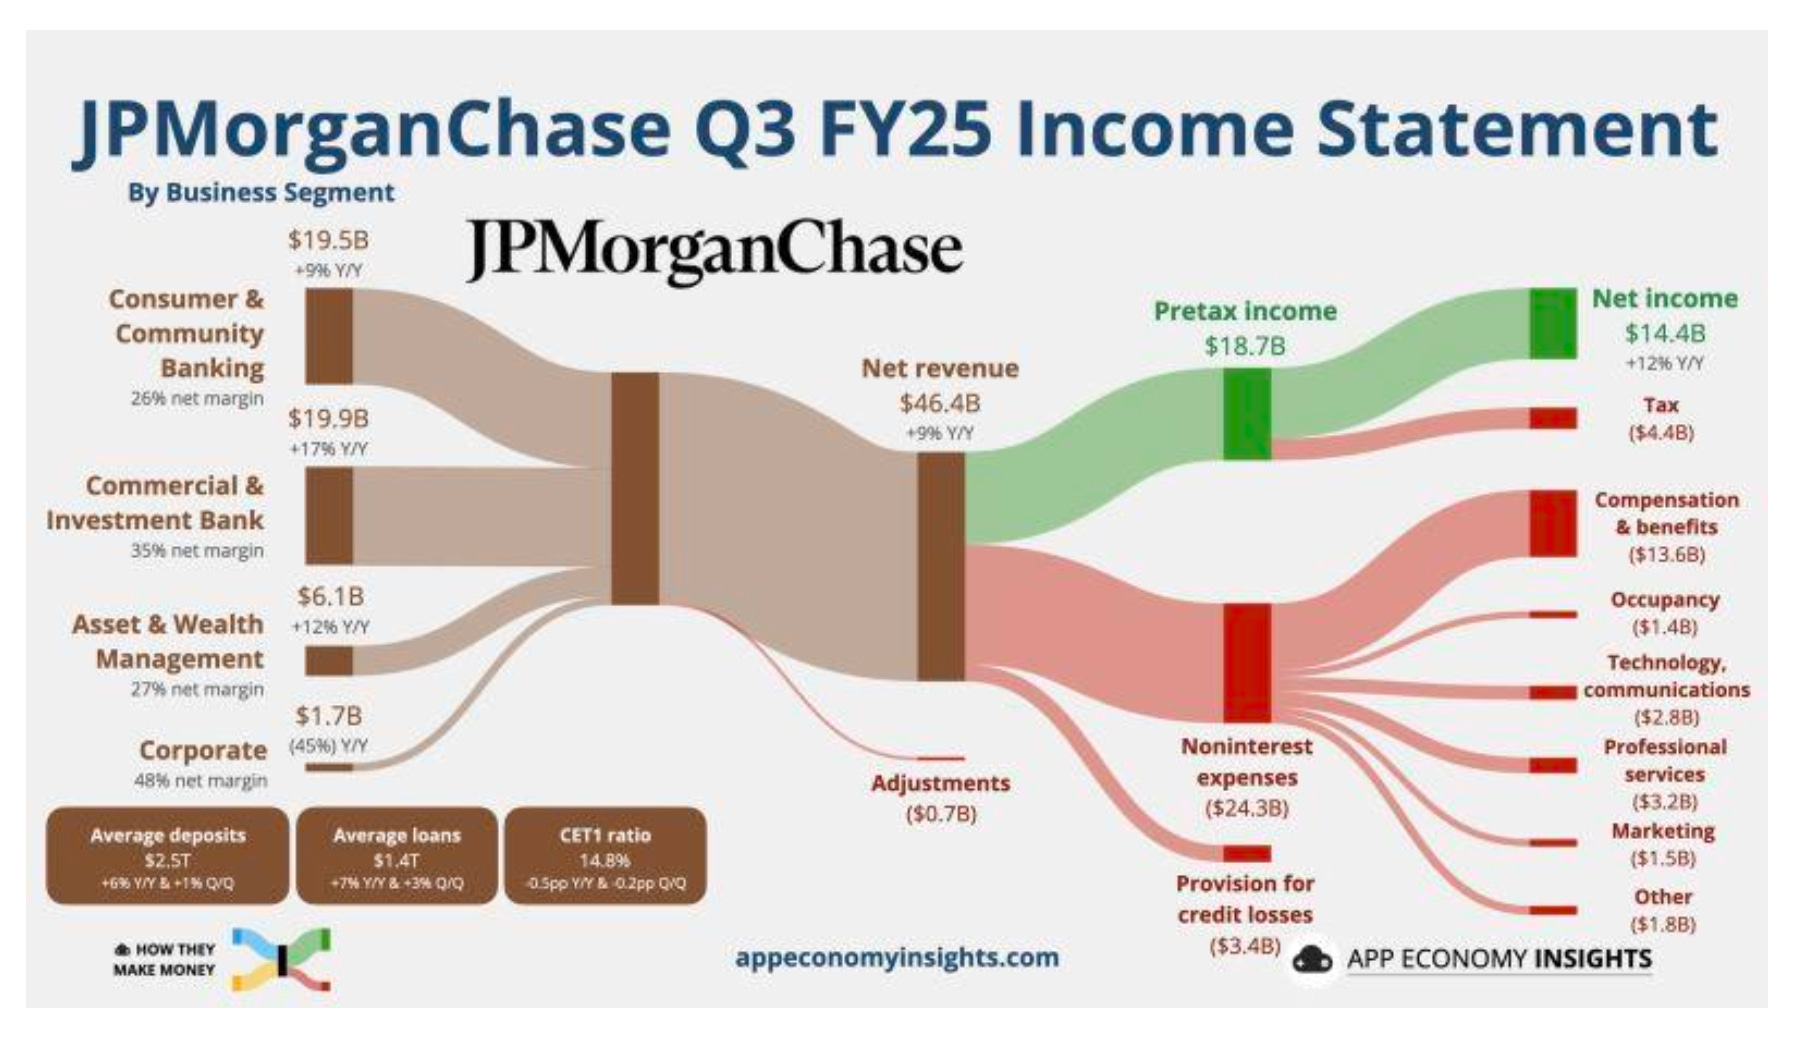
Chart 4: The Only Bank to Own
I’m not a guy who spends a lot of time in the banking sector. That’s reserved for my father-in-law, who has a great strategy to take advantage of banking M&A.
So, I own one bank, and one bank only: JPMorgan (JPM). And why not?
(Click on image to enlarge)
It’s literally the backstop of the financial system. Every time there’s a problem in a regional bank, the Fed sells it to them for the price of a hot dog. Yes, it will go up and down - but it’s largely a reflection of global liquidity conditions. The stock front-runs credit expectations - so, yes, still long.
If I were more cynical, I’d just tell you that there will come a day that you’ll have six banking options for your accounts - and JPMorgan will be the top choice. I’m half-joking. Probably.
Chart 5: The Leverage Game
Finally, this is the leverage in the system. Over the years, ongoing increases in liquidity (capital in the system) popped to new highs - and when the cycle stopped, the markets got beaten up.
We have been on a straight move up since the late 2022 period, when the GILT Crisis happened and the Treasury Department got more aggressive with short-term debt issuance.
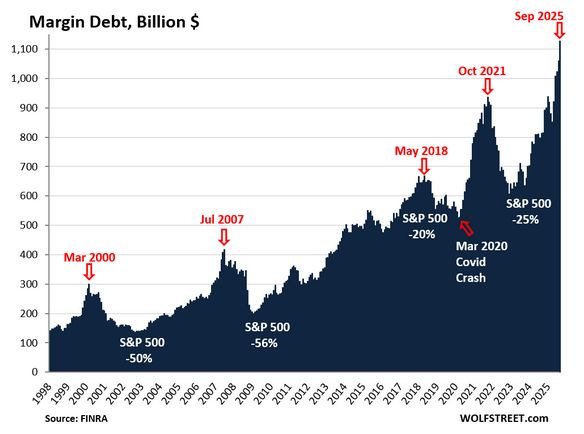
Yes, there will be another period where we see markets come back down and it will accompany a few things, such as the drainage of excess liquidity, which we track; a series of momentum swings into negative territory, which we track; and, ultimately, a period where the Federal Reserve and policymakers end up crying uncle, injecting capital back into the system, and keeping the game going.
In other words: The money printer rides again. Stay positive.
More By This Author:
The $110 Trillion Shadow Banking Secret That Breaks Every Bear Case
Financialization And Other Observations
Beyond Warren Buffett: The New Recipe For Wealth Building And Income Protection

Comments
Log in or sign up to join the conversation.