
Uber Technologies Stock Looks Cheap
UBER's strong free cash flow and FCF margins could push UBER stock +27% higher to $119 per share
- Uber's Q2 results showed strong revenue and FCF growth.
- It has now posted two full quarters of over 19.5% FCF margins.
- Based on analysts' 2026 revenue forecasts, FCF could rise to over $10.85 billion in the next 12 months. That could push its valuation higher.
- Using a 4.37% FCF yield metric, UBER stock could be worth 27% more, or $119.00 per share.
Uber Technologies, Inc. (UBER) reported strong Q2 revenue and free cash flow (FCF) results on August 6.
UBER stock looks too cheap here, based on its strong FCF margins, its operating leverage, and analysts’ revenue forecasts.
It’s up +5% since Aug. 6, but it could still have well 27% upside. This article will show why.
Strong Revenue Growth and Underlying Metrics
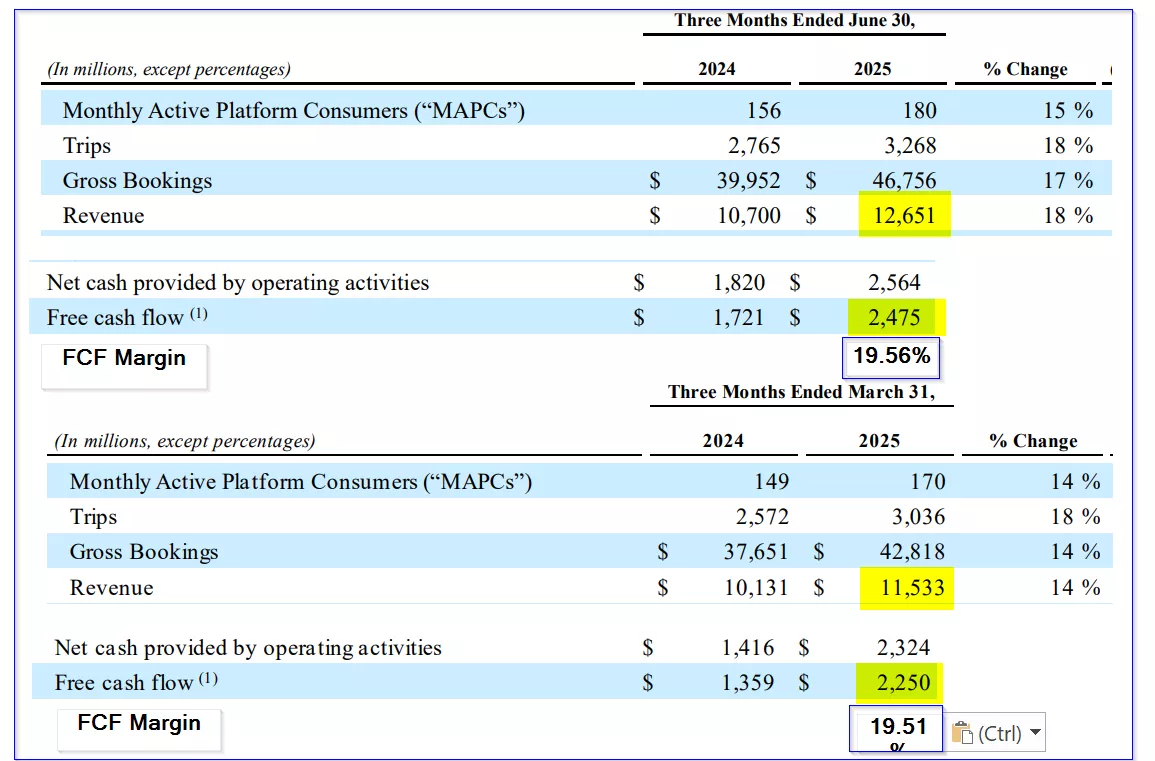
Revenue rose 18.2% YoY to $12.65 billion in Q2 from $10.7 billion last year. It was up almost 10% (+9.69%) from Q1’s $11.533 billion revenue.
Uber is gaining popularity. It now has 180 million active users each quarter, up +15% Y/Y and +5.88% from last quarter’s 170 million. At this pace, it could end up with over +23.5% higher number of users next year, so growth may be accelerating.
This has led to significantly more trips and bookings using Uber vehicles. For example, in Q2 it had 18% more trips and 17% more bookings than a year ago.
There is reason to believe its growth in bookings is accelerating. For example, in Q1 it booked 42.818 billion trips, but that rose +9.43% in Q2 to $46.856 billion. In other words, this represents an annual run rate of +37.72% (before accounting for seasonal effects).
The point is that revenue forecasts may be significantly too low.
For example, the midpoint of Uber management’s booking guidance last quarter (Q1) was 46.5 billion bookings for Q2. But Q2 came in at $46.856, or +0.76% higher.
Uber does not provide estimates for 2025 revenue, but there appears to be a strong correlation between bookings growth and revenue growth. This means its growth seems to be accelerating.
For example, analysts are now projecting $51.46 billion in 2025 revenue, according to a survey of 46 analysts by Seeking Alpha. That implies H2 revenue will be $27.3 billion or an annualized run-rate of $54.6 billion:
$51.46 billion 2025 est. - $24.184b H1 = $27.276b H2 revenue
$27.276b H2 x 2 = $54.552 billion annualized run rate
In other words, revenue growth is accelerating. The $51.46 billion 2025 analyst estimate is +17% higher than 2024 ($43.978b). But its H2 run rate could result in a 24% growth over 2024:
$54.552b (H2 run rate) / $43.978b (2024) = 1.24 -1 = +24% rise over 2024
In fact, for 2026, analysts are forecasting revenue of $59.29 billion. That implies a 15.2% year-over-year (Y/Y) growth rate over 2025 and a 2-year annualized growth rate of 34.8% (or 17.4% per year).
This coincides with management’s projections for bookings in Q3 to rise between 17% and 21% on a Y/Y basis.
The bottom line is that with an ever-increasing number of users and higher bookings, Uber’s revenue outlook looks very strong. It may continue to surprise analysts on the upside.
Accelerating FCF Margin Growth – Operating Leverage
Uber is now very profitable on a free cash flow (FCF) basis. It generated $2.475 billion in FCF for Q2, which was an astounding +43.8% over last year’s $1.721 billion in FCF.
That was also +10% higher than last quarter’s (Q1) $2.25 billion in free cash flow. This implies it’s on an annualized growth rate of 40%.
Source: UBER’s Q2 and Q1 earnings reports and Hake analysis of FCF margins
However, a better way to look at FCF projections is to use a FCF margin analysis. For example, in Q2 its FCF/revenue was:
$2.475b / $12.651b revenue = 0.1965 = 19.65% FCF margin
That was similar to what happened in Q1 (i.e., $2.25b / $11.533 b revenue = 19.5% FCF margin).
This is confirmed by data from Stock Analysis, which shows UBER’s quarterly FCF margins. Its prior quarterly FCF margins were 14.27% in Q4 2024, 18.85% in Q3 2024, 16.08% in Q2, and 13.41% in Q1 2024.
That means its FCF margins have been accelerating even with higher revenue. That means it's squeezing out more costs as revenue rises. That is known as operating leverage.
Its operations are leveraging free cash flow (i.e., accelerating its growth) as revenue rises. That’s a sign of a truly focused management team along with an inherently powerful business model.
We can also use its FCF margins to project its FCF.
Forecasting Free Cash Flow
For example, using analysts’ 2025 and 2026 revenues forecasts, the next 12 months (NTM) revenue could be
( $51.46 billion (2025 est.) + $59.29 billion (2026 est.) )/2 = $55.375 billion NTM revenue
As a result, FCF could come in at over $11.3 billion next year:
$55.375b NTM revenue x 19.6% FCF margin = $10.85 billion FCF 2026
That implies that it would be almost 10% higher than the Q2 run rate FCF:
$10.85 b FCF / ($2.475b Q2 FCF x 4) = $10.85b / $9.9b = 1.096 -1 = +9.6% growth rate
But it would be +57.4% higher than 2024’s $6.895 billion FCF and +27% higher than its trailing 12-month FCF of $8.54 billion.
This could lead to a significantly higher target price for UBER stock. Here is why.
Projecting a Target Price
Uber’s valuation can be measured using FCF yield as a metric.
For example, in the last 12 months (LTM), Uber has generated $8.54 billion in FCF, according to Stock Analysis.
That represents 4.37% of its market cap today, which is $195.5 billion, according to Yahoo Finance:
$8.54b LTM FCF / $195.5 billion market cap today = 0.04368 (4.368%)
That gives the stock a 4.37% FCF yield. We can apply that to its forecasted FCF:
For example, using the $10.85 billion NTM FCF forecast (above):
$10.85 billion FCF / 0.0437 = $248.3 billion target market cap
That is 27% higher than its market cap today:
$248.3b / $195.5 billion today =1.27 -1 = +27.0% upside
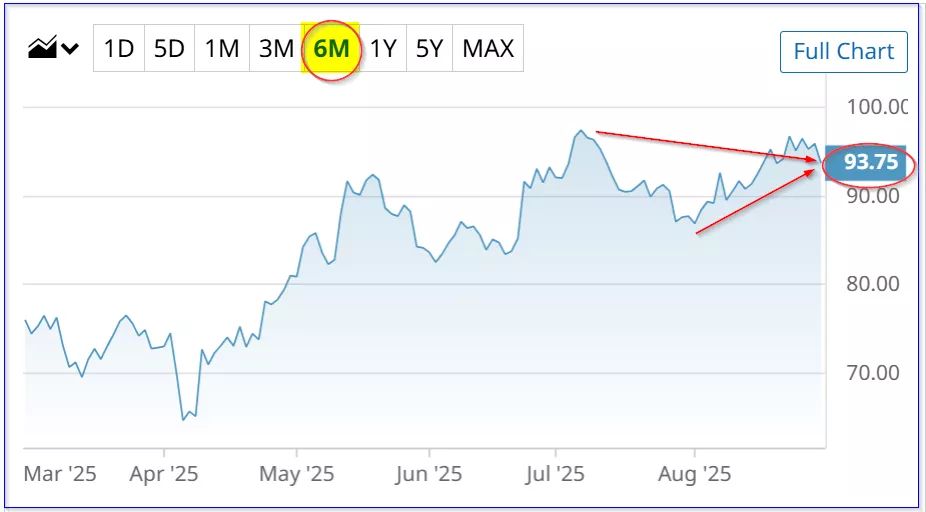
In other words, UBER stock is worth 27.0% more than its price on Aug. 29 of $93.75:
1.27 x $93.75 p/sh = $119.06 Target price
This is based on the next 12-month (NTM) revenue projection and its latest Q2 FCF margin. Using a 2026 revenue forecast and a higher FCF margin (which is likely to occur given its operating leverage), could result in a higher price target.
For example, its FCF margins could rise over 20% from the 19.5% rate used in this forecast (in Q2 it was 19.65%, up from 19.5% in Q1 and 16.08% a year ago).
Summary and Conclusion
Uber’s growth rate appears to be accelerating, and this is reflected in its higher free cash flow margins.
The point is that higher revenue growth, with fairly stable operating cost margins, is showing operating leverage.
That could lead to a 19.5% FCF margin in 2025 on 17% higher revenue over 2024. Moreover, analysts are likely to raise their forecasts.
The bottom line is that, using a 4.37% FCF yield metric, UBER stock could be worth 27% more at $119.00 per share.
More By This Author:
Snowflake Is On A Tear - Its Massive Free Cash Flow Could Push SNOW Even Higher
Nvidia's Free Cash Flow Falters From Higher Capex - Is NVDA Stock Fully Valued?
Unusual Put Option Activity In Pfizer Stock - Have Investors Turned Bearish?
Disclosure: On the date of publication, Mark R. Hake, CFA did not have (either directly or indirectly) positions in any of the securities mentioned in this article. All information and ...
more

