
The S&P SmallCap 600 – A Sector-Led Bounce Back
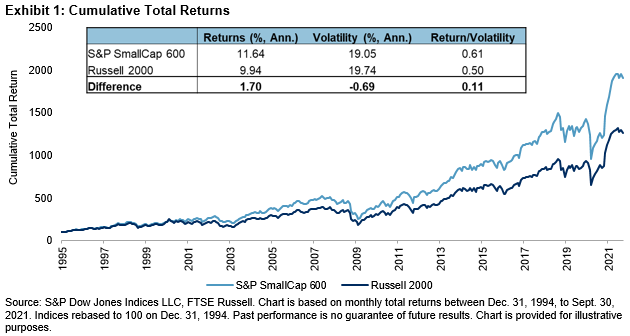
For over 11 years, S&P Dow Jones Indices has been exploring the long-term, persistent outperformance of the S&P SmallCap 600® relative to the Russell 2000. As shown in Exhibit 1, the S&P 600TM has outperformed the Russell 2000 by 1.70% on an annualized basis from Dec. 31, 1994, to Sept. 30, 2021. The S&P 600 has also experienced slightly lower volatility.
The S&P 600’s historical outperformance has been consistent over various rolling time periods, especially over longer horizons. Indeed, Exhibit 2 shows that the S&P 600 outperformed the Russell 2000 in 202 of the 310 (or 65%) rolling one-year periods between Dec. 31, 1994, and Sept. 30, 2021. The frequency of outperformance increased with the time horizons.

Despite the long-term track record, there have been periods where the S&P 600 has underperformed. For example, the S&P 600 underperformed by 8.86% and 8.65% in 1999 and 2020, respectively. These were the two worst calendar year periods for the S&P 600, based on relative returns. However, both examples were followed by substantial bounce backs in the following year. The S&P 600’s best year of relative performance came in 2000 (up 14.83%), and the S&P 600 has outperformed the Russell 2000 by 7.64% YTD in 2021, as of Sept. 30, 2021.
So, what has been behind this recent turnaround?

A large part of the relative performance in 2020 and 2021 can be explained by the exposure of each index to a single sector—Health Care. Exhibits 4 and 5 show a Brinson Attribution for 2020 and YTD 2021, using the S&P 600 as the portfolio and the Russell 2000 as the benchmark. Here we use the iShares Russell 2000 ETF as a proxy for the Russell 2000, so the returns do not tie out exactly to Exhibit 3.
In Exhibit 4, the Total Effect column on the far right shows that the S&P 600 underperformed the Russell 2000 by 8.59% in 2020. The rows in the table show the 11 GICS® sectors along with the two industry groups within the Health Care sector. The Contribution to Return columns indicates how much each sector or industry group contributed to the relative return for each index.

In 2020, we can see that the S&P 600 had an average weight of 20.51% in the Health Care sector compared with 12.62% for the Russell 2000, resulting in an underweight of 7.89%. The Health Care sector contributed -4.21% to the -8.59% relative performance of the S&P 600 (or 49%). We can further decompose the performance of the Health Care sector into an allocation effect (the impact of underweighting the sector) of -1.84% and selection effect (the impact of selecting stocks that underperformed their peers in the sector) of -2.37%. Drilling further into the industry groups within the Health Care sector, we can see that Pharmaceuticals, Biotechnology & Life Sciences was the largest contributor, at -2.67%.
Turning to Exhibit 5, we can see that the story of 2020 has largely reversed in 2021. The S&P 600 has remained underweight in Health Care (-8.14%), but this year the sector has underperformed the broad small-cap market significantly. Year-to-date, the S&P 600 outperformed the Russell 2000 by 7.07%, indicated by the Total Effect column on the far right. The Health Care sector accounted for 3.30% (or 47%) of the outperformance. Looking at the industry groups within the Health Care sector, we can see that Pharmaceuticals, Biotechnology & Life Sciences has contributed most of the outperformance, at 2.90%.

Since Dec. 31, 1994, the S&P 600 has outperformed the Russell 2000 by 1.70% annualized. This outperformance has been consistent through time, particularly when we look at longer time horizons. However, when we look at annual returns, we can see periods when the S&P 600 has underperformed. The two worst years of relative performance for the S&P 600 (1999 and 2020) have been followed by significant bounce backs the following year. Year-to-date in 2021, much of that bounce back can be attributed to the S&P 600 having less exposure to health care companies compared with the Russell 2000.
Disclaimer: Copyright © 2021 S&P Dow Jones Indices LLC, a division of S&P Global. All rights reserved. This material is reproduced with the prior written consent of S&P DJI. Please ...
more

