
The month of April may have been a winning one for the market. But, stocks didn't end the month on the high note the bulls were hoping for. While the indices logged bullishness on Thursday and Friday, that move wasn't enough to get any of them above the technical ceilings that were standing in the way just two weeks back. The market only moved back to those levels, leaving them within striking distance of that resistance. One more day could get them over the hump.
We'll look at the effort in some detail in a moment. Let's first run through last week's biggest economic news and preview what's coming this week. Spoiler alert: Friday's jobs report has the potential to rattle the market, for better or worse.
Economic Data Analysis
Last week wasn't loaded with economic news. But, what we got was hard-hitting.
The highlight of course was last week's decision from the Federal Reserve regarding interest rates. As was expected, the FOMC upped the fed funds rate by another quarter-point. To the delight of most everyone though, the Federal Reserve also strongly suggested this would be the last one needed for a while... at least assuming nothing major changes in the foreseeable future. That's good.
It was also a big week for other economic activity barometers like the Institute of Supply Management's indexes. The services index inched up from 51.2% to 51.9%, and while the manufacturing index is still below the pivotal 50 mark, it too inched higher, from 46.3% to 47.1%. Even so, both indexes remain in alarming downtrends.
ISM Services, Manufacturing Index Charts
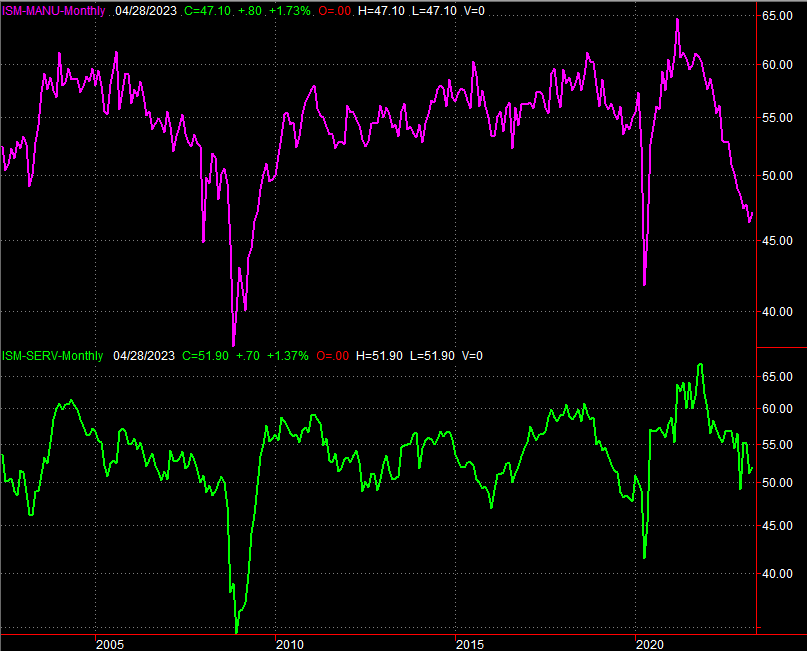
Source: Institute of Supply Management, TradeStation
The jobs report of April was encouraging too. The nation added 253,000 new positions last week despite waves of layoffs versus expectations of only 165,000 additional payrolls, driving the unemployment rate down from 3.5% to 3.4% (versus estimates for a rise to 3.6%).
Unemployment Rate, Payroll Growth Charts
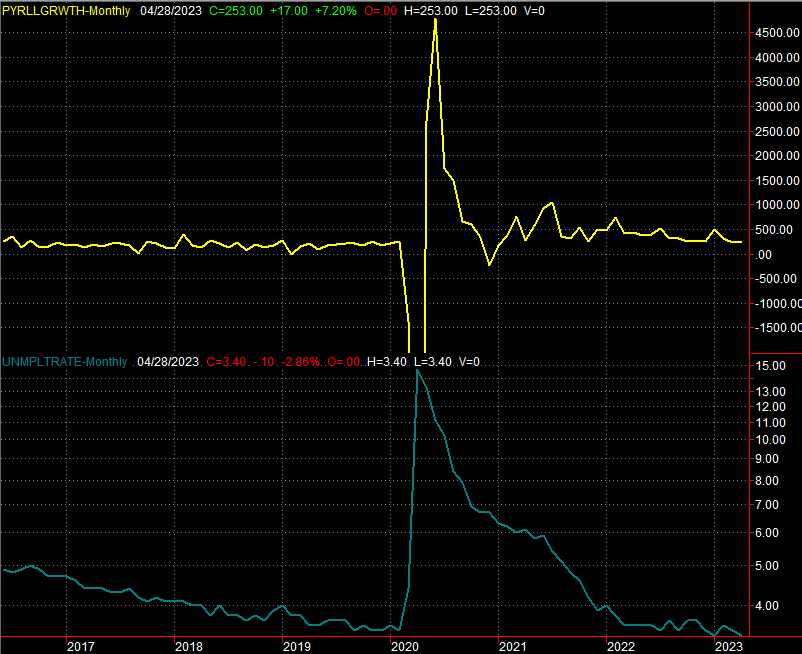
Source: Bureau of Labor Statistics, TradeStation
Everything else is on the grid.
Economic Calendar

Source: Briefing.com
There's very little coming this week, although we will hear about last month's inflation rates... something that could move the market. You'll recall that, while still relatively high, inflation rates have been coming down. We're not expected to see a whole lot of continued relief this time around.
Consumer, Producer Inflation Rate Charts
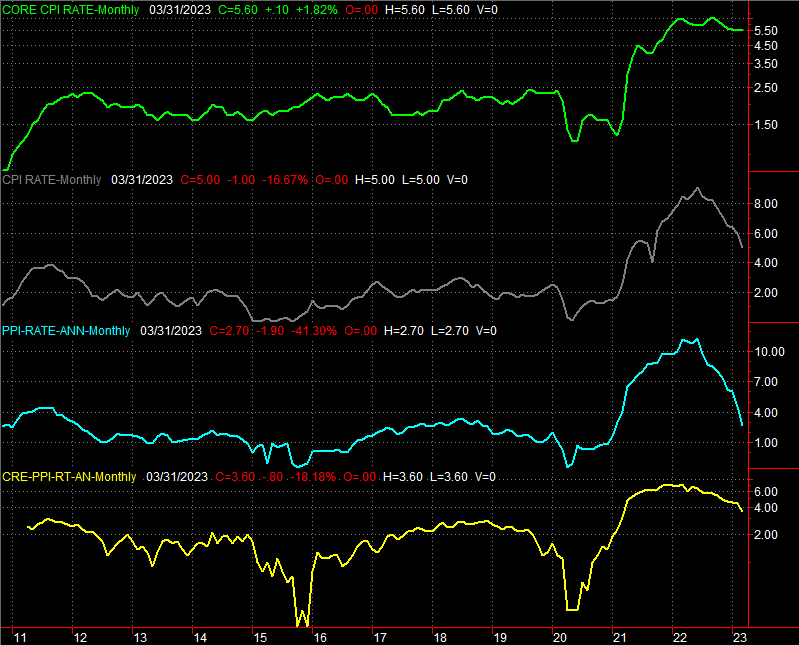
Source: Bureau of Labor Statistics, TradeStation
Undoubtedly this week's inflation figures will be used to either question and/or support the Fed's decision to impose one last rate increase before turning a little less hawkish, and a little more dovish. Regardless of any of that rhetoric, any conceivable inflation scenario at this time is still unusually high. There's no room for error with expectations that price growth will continue to cool.
Stock Market Index Analysis
The market ended last week on a high note. But, it just wasn't enough to overcome a sizeable selloff in the middle of the week. End result? None of the indices were able to hurdle the same technical ceilings that have been holding them back since early February.
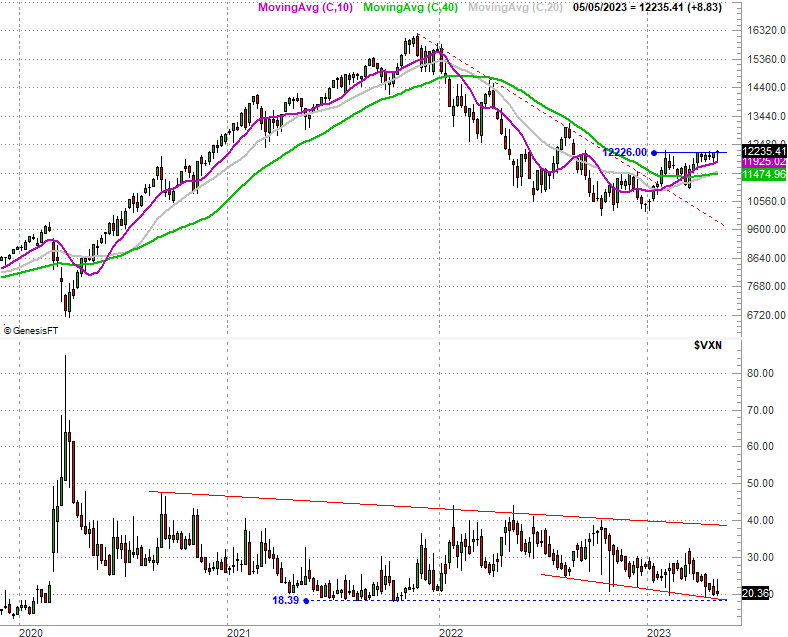
Nowhere is this more precisely evident than on the daily chart of the NASDAQ Composite. Take a look. The composite's close of 12,235 is right in line with the prior week's peak, and the high from late March, the early February peak (blue, dashed). There's something about that level.
NASDAQ Composite Daily Chart, with VXN

Source: TradeNavigator
It's not all bad. Although the NASDAQ isn't making net forward progress, it is finding technical support where it needs to. Notice that it pushed up and off of the 50-day moving average line (purple) two weeks back, and used the 20-day moving average line (blue) as a pushoff point on Friday. Moreover, the repeated test of resistance at 12,235 implies the bulls will eventually break through. In the meantime, the longer the buildup period is, the bigger the breakout thrust tends to be.
The weekly chart of the NASDAQ Composite gives us a better perspective on the budding breakout effort. From this vantage point we can see the index has already snapped 2022's downtrend with a higher high and higher low.
The one big downside? The NASDAQ Composite's Volatility Index (VXN) is very near a major convergence of technical support at 18.4. This implies the market itself may be nearing a fairly significantly high, as it's difficult stocks to continue rallying when a "fear gauge" is this dangerously low.
NASDAQ Composite Weekly Chart, with VXN
Source: TradeNavigator
The S&P 500 is in a similar -- although not identical -- situation. The horizontal resistance line (blue) at 4175 is still intact, as is the falling resistance line (red, dashed) that connects most of the major highs going all the way back to August's peak. Even so, the index has logged higher highs and several higher lows since October's bottom. The tailwind is bullish.
S&P 500 Daily Chart, with VIX and Volume
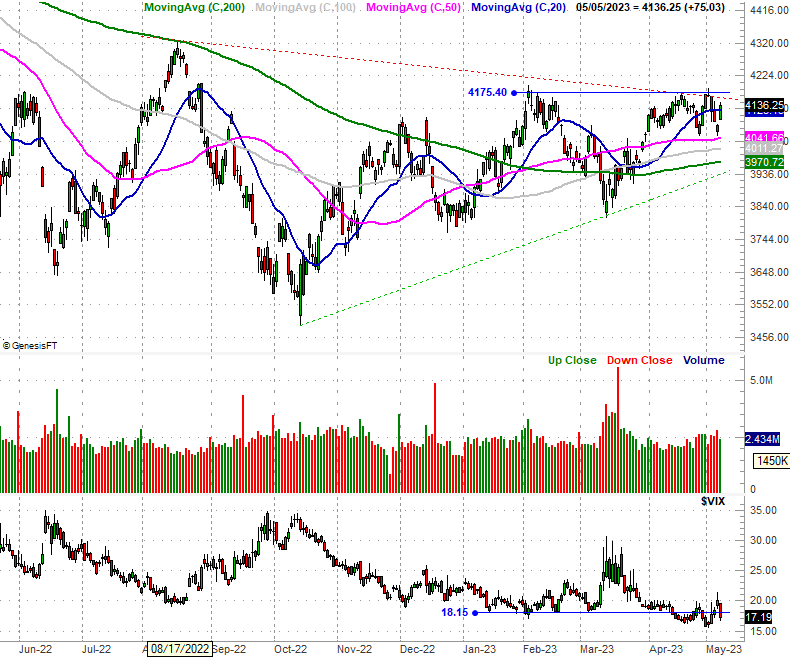
Source: TradeNavigator
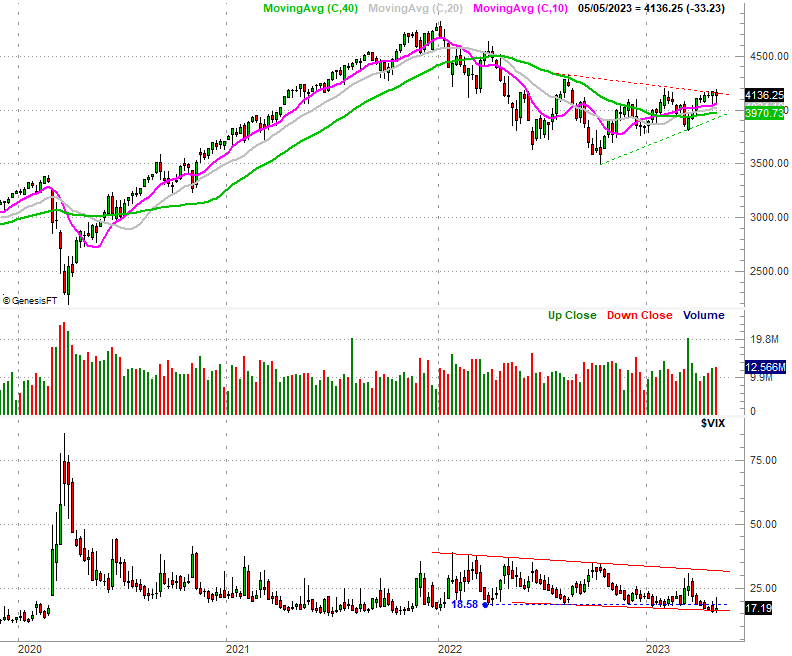
The weekly chart of the S&P 500, however, show is the same core problem with the NASDAQ Composite. That's its volatility index. It's been drifting lower for a few weeks now, bring the VIX to the lower edge of its falling trading range (framed with red lines) as of the past couple of weeks. There's not a whole lot of room for the VIX to keep falling, which makes it tougher for the S&P 500 to keep rallying.... tougher, all though not impossible.
S&P 500 Weekly Chart, with VIX and Volume
Source: TradeNavigator
Let's assume the current bullish momentum will remain intact until we clearly can't. And, don't sweat too much if the market peels back a bit first. There's room for a lull. The key is finding continued support at all of the index's key moving average lines. The flipside: Let's not get too excited just yet either. The indexes really need to break above their well-established technical ceilings before we can assume another leg of bullishness is in the cards.
More By This Author:
Presidential Term Analysis: Look For A Brief Blip, Then A Bit Of Bullishness, Then....
Sell In May And Go Away? Here's The Rest Of The Story
Weekly Market Outlook - Back to the Brink, But Not Over The Hump

Comments
Log in or sign up to join the conversation.