

Image Source: Unsplash
In theory, the thinking seems sound enough. People are disinterested and distracted during the summer. It stands to reason they're not trading much, driving stocks higher or lower. You may as well take the summer off, and wait until things turn active again in October.
There's a problem with the whole "sell in May and go away thing" though. While there's some data that's generally supportive of the well-intended idea, there are also some important (and often overlooked) footnotes to add to the theorem. Chief among them is that there's actually a fair amount of bullishness -- on average -- between the end of May and late August. It's just that much of that average gain is wiped out in September. If you play your cards right you can capitalize on the ebb and the flow.
Then there's perhaps the more important nuance. That is, this time of year is only lethargic when the market's in a bear market. In the usual bullish environment, stocks make about as much progress in the dog days of summer that they do any other time of year.
The graphic below tells the tale. In the average year the S&P 500 falls about half of a percent in May. But, that's the extent of the summertime swoon... on average. From that point, the S&P 500 gains an average of about 3.0% through the end of August. September is a loser, with stocks slipping on the order of 1.5%. Then the usual year-end bullishness kicks in.
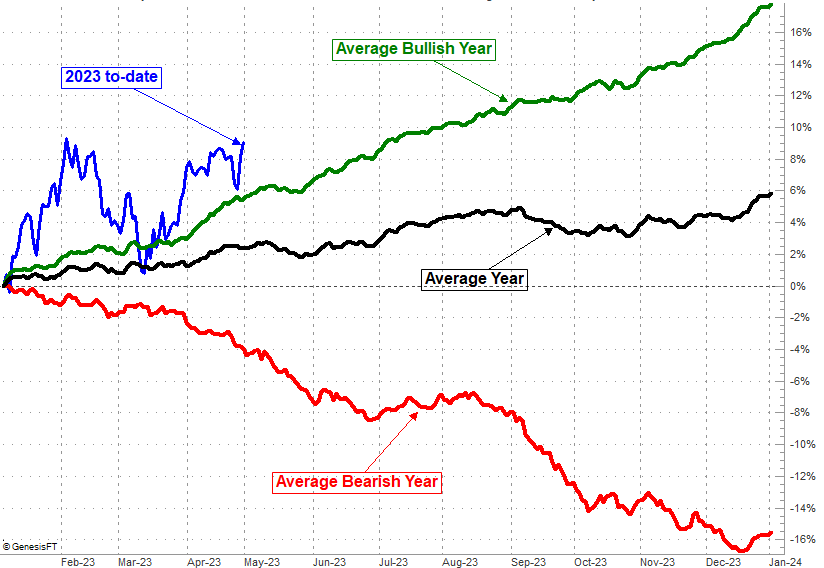
But, that's the overall average, which is dramatically weighed down by the few-but-intensely-bearish years in which stocks are set to lose ground for the year. In other words, a bear market. Only about one out of every three to four years is a bear.
Take another, closer look at the chart above again. Specifically, look at the portion of the image at the very top that depicts the average cumulative gain for the S&P 500 in bullish times. While May is still a little turbulent in these instances, the rest of the time between the end of May and... well, all the way through the end of the year. In bull markets, the S&P 500 advances an average of a little more than 5% between the beginning of June and the end of September. That's more or less the market's typical bullish pace before or after that time of year.
The flaw in this analysis is, we don't really know how the market's going to end this year. We only know how it's beginning 2023. If we're on track for a losing year, the next several months will be anything but the norm.
What's interesting, however, is that stocks tend to end the year how they start it. That is to say, bearish years start out bearishly, and bullish years start out bullishly. There's plenty of reason to believe the S&P 500 will stay near its usual bullish or bearish path.
The bigger point here is, though, don't be too quick to simply sell in May and go away. The summertime tendency is actually net-bullish, and particularly so when we're not in a bear market. (Of course, when we're in a bear market, late summer can really, really hurt.)
More By This Author:
Weekly Market Outlook - Back to the Brink, But Not Over The Hump
It's Not The Ideal Rally, But It's Still A Rally
Weekly Market Outlook - Over The Hump

Comments
Log in or sign up to join the conversation.