
Like air slowly leaking out of the valuation balloon it's been mostly down to the right for the S&P 500 Index since failing to overcome resistance from the 200-Day Moving Average on August 16. Now well below the upward sloping trendline, USTL from 3721.56 and below the 50-day Moving Average, odds favor a retest of the June 17 low.
S&P 500 Index (SPX) 3924.26 slid 133.40 points or -3.29% in addition to 170.82 points or -4.04% the week before.
According to Dow Jones market data back to 1928, the SPX averaged a loss of 1% in September making it the worst month of the year.
Start with September seasonal weakness, add in Friday's failure at the 50-day Moving Average at 4020.21 along with a dramatic market breadth decline (see below) results in increasing the probability the SPX will soon retest the June 17 low at 3636.87, the point that defines the starting point for the new upward sloping trending USTL –now broken.
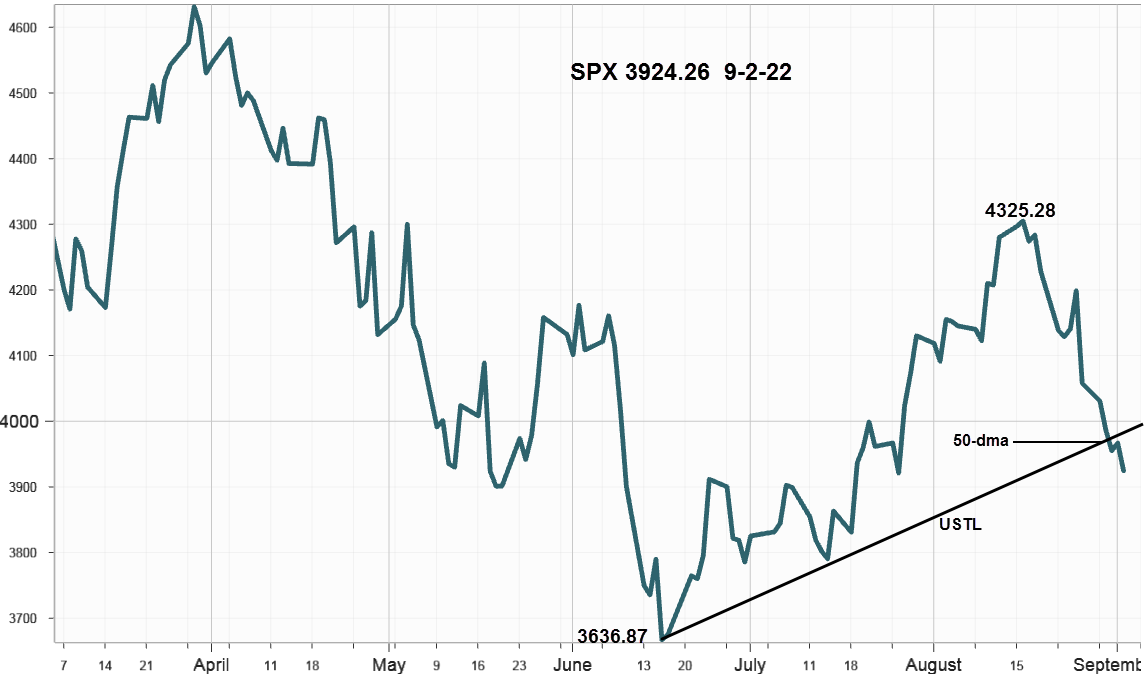
Currently in oversold territory according to the 14-day RSI at 35.23, along with a low volume qualifier applicable for all indices and indicators during the last two weeks, it could attempt a short-term bounce as traders return to work after the August summer break. However, unless the macro condition improves it will likely slip away quickly.
Interest Rates
Despite declining across the curve after Friday's employment report yields increased for the week with the 10-Year Treasury Note ending at 3.20% up 16 basis points (bps). The 2-Year Note increased 3 bps to 3.40% for a 10-2 spread of -20 bps compared to -33 bps on Friday, August 26. The fixed income market seems to understand rates are headed higher. Meanwhile, some equity bulls cling to the notion the Fed will cease raising rates when unemployment starts to rise.
Market Breadth as measured by our preferred gauge, the NYSE ratio adjusted Summation Index that considers the number of issues traded, and reported by McClellan Financial Publications declined 431.11 points in addition to a 219.30 point decline the previous week to end at 179.76 quickly approaching the 50-day Moving Average just below at 126.87. Watch to see if breadth improves on any oversold bounce.
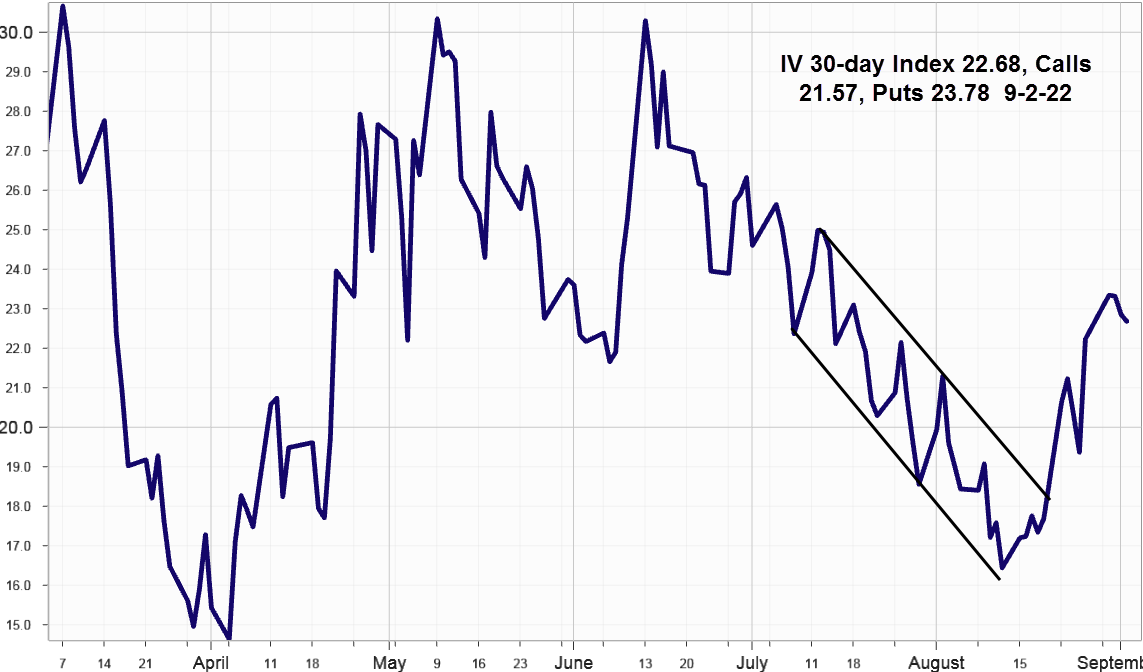
Implied Volatility
SPX options implied volatility index, IVX gained slightly adding .45% to 22.68% from 22.23% last week with Calls at 21.57% and Puts at 23.78%.
Summing Up
Last week the bears pressed their advantage with help from rising rates across the curve, although gaining less than expected after declining on Friday's employment report. SPX failed at the 50-day Moving Average and closed below the new operating upward sloping trendline. A dramatic decline in market breadth reflects noticeable weakness in part due to low August summer volume. Referring to the macro condition, the Energy sector gained slightly on Friday, perhaps due to short covering before the holiday weekend and the OPEC+ meeting on Monday since traders would not want to be short in the event they announce a production cut in anticipation of slowing global growth.
More By This Author:
Bull Bounce Over
Market Makers Prepare For Large Moves In PTON And DOCU
Term Structures Steepen, Looking At GS
Comments
Log in or sign up to join the conversation.